What a 1,000-juror synthetic respondent panel cannot tell you about vaccine refusal
Probability-vector polling mitigates the Bisbee 2024 within-cell variance collapse observed when modeling human respondents. The approach worked for 10 of 11 questions selected from Pew Research's ATP Wave 158. A separate structural bias on vaccine refusal survives every cross-model and option-order permutation. Regression coefficient analysis and methods materials within.
The claim
I built a 1,000-juror synthetic respondent panel calibrated to an 85-variable selection from the 2024 ACS demographics dataset, plus Pew and GSS opinion priors. I programmatically asked it the 11 questions from Pew's October 2024 American Trends Panel Wave 158, then compared its answers to the actual Pew respondents'. Two findings stood out.
First, switching from direct-choice polling (“pick one option”) to probability-vector polling (“rate the probability of each option”) substantially mitigated the within-cell variance compression that Bisbee et al. (2024) identified as a core risk for synthetic respondent panels, on 10 of 11 questions.
Second, I observed a separate issue: directional bias on specific topics, most cleanly on vaccine refusal, that survived every cross-model and option-order permutation I tested.
This post demonstrates why the first finding is meaningful and methodologically sound, why the second finding matters more, and what either tells you about whether you can use a synthetic panel in 2026 for your given purpose.
What Bisbee 2024 actually said
Bisbee et al. (2024) prompted ChatGPT-3.5 to adopt personas matched to American National Election Studies respondents (real ANES covariates as prompt inputs: age, race, gender, education, income, ideology, party ID, political interest, marital status) and asked the synthetic respondents the same survey questions the real ANES respondents had answered. The aggregate means looked acceptable. Synthetic means fell within one ANES standard deviation. The within-cell variance did not. Synthetic responses were more tightly distributed than the real ones, especially on charged topics centering racial and religious groups. Subgroup regression coefficients diverged, their signs sometimes flipped. Minor prompt changes and reruns months apart moved the distributions noticeably.
The Bisbee result is precise. It identifies a measurable issue: the model produces a familiar output that looks right on the surface but shows cracks upon inspection. These cracks are severe enough to give polling and advertising professionals pause before using such systems to replace or supplement human respondents. Larger demographic prompts can leave the core gap intact, and the failure is structural enough to risk hard-coding distribution data into anything subsequently published.
The literature has moved in two directions since.
Direction One: Argyle et al. (2023) and Park et al. (2024) explore whether richer person-grounding can recover the missing structure.
Direction Two: Santurkar et al. (2023) and Li, Li, and Qiu (2025) catalogue the failure modes more precisely: (a) minority opinion homogenization, (b) demographic-cell stereotyping, (c) prompt sensitivity, and (d) item-by-item heterogeneity.
Both lines make direct-choice prompting appear fragile.
The synthetic respondent panel
The sample
I sampled 1,000 jurors from the IPUMS USA ACS 2024 1-year PUMS extract (filtered on above-18 adults, 2.76M records) via probability proportional to size. The jurors were post-processed with iterative proportional fitting on race, age, education, and Census region marginals to produce calibrated analysis weights bounded to [0.33x, 3x] per juror. Raking is the post-stratification calibration. The bounded weight cap prevents any singular, weirdly weighted juror from dominating an interaction cell.
Endowing traits
Traits PUMS does not cover (party, ideology, religion, religiosity, media diet, household composition) are sampled conditionally from published Pew (NPORS 2025, ATP W133, Religious Landscape Study 2023-24, News Platform Fact Sheet, Political Gap in News Sources) plus Census CPS ASEC and GSS multi-issue battery extracts. Every prior persists provenance data throughout the analysis; the scripts and runtime environment are designed to refuse loading priors without it. Life-stage transitions (recent_parent, recently_divorced, recently_relocated) come directly from PUMS event flags rather than from second-pass conditional sampling, which preserves real Census joint covariance with the rest of the trait vector.
Accounting for outliers
7% of the panel are purposefully calibrated as outliers: each carries a concrete non-modal opinion drawn from the actual GSS non-modal rate for their respective coarse demographic cell (e.g., a white evangelical assigned a pro-choice position drawn from the real ~25% of white evangelicals who reflect that position), and a “personality expansion” prompt builds the narrative around the tension. The non-modal opinions are sourced for abortion, guns, immigration, same-sex marriage, and marijuana. They are not sourced for Pew Wave 158 topics, which is discussed later.
Biography and Narrative Expansion
Each juror's trait vector is expanded by an LLM (this study used Claude Sonnet 4.6 for defaults at three temperatures and Claude Opus 4.5 for outlier construction) into a coherent multi-paragraph narrative. Temperatures vary across the panel to defend against the persona-expansion step contributing to response-variance-collapse.
The panel was designed for validation: every metric is weighted, every per-cell metric carries a 1,000-iteration bootstrap 90% CI, and a coverage rule (≥80% of top-level validation cells and ≥50% of interaction cells must clear minimum-n thresholds) determines whether the harness has enough measured cells to score the run.
The 11 Pew Wave 158 questions
Pew's ATP Wave 158 was fielded October 21-27, 2024 to a nationally representative sample of US adults (n=9,593). Eleven questions were selected for the replication, spanning climate, COVID retrospective, trust in scientists, spiritual practices, and policing — a mix of opinions whose response formats (binary, three-option, four-option ordinal, five-option mixed) reasonably cover topical valences (low-charge to high-charge) the validation surface needs to span.
| ID | Topic | Question wording (verbatim Pew W158) | Response options |
|---|---|---|---|
| Q1 | Climate impact | How much, if at all, do you think global climate change is currently affecting your local community? | A great deal / Some / Not too much / Not at all |
| Q2 | Climate cause | How much do you think human activity, such as the burning of fossil fuels, contributes to global climate change? | A great deal / Some / Not too much / Not at all |
| Q3 | Climate policy | Do you think policies aimed at reducing the effects of global climate change generally help the U.S. economy, hurt the U.S. economy, or make no difference? | Help / Hurt / Make no difference |
| Q4 | Scientist confidence | How much confidence, if any, do you have in scientists to act in the best interests of the public? | A great deal / A fair amount / Not too much / No confidence at all |
| Q5 | Scientist policy role | In general, would you say scientific experts are usually better, worse, or neither at making good policy decisions about scientific issues than other people? | Usually better / Usually worse / Neither better nor worse |
| Q6 | COVID restrictions | Thinking back on COVID-19 restrictions on public activity in your area, do you think there should have been more restrictions, fewer restrictions, or were the restrictions about right? | More / Fewer / About right |
| Q7 | School closures | Thinking back over the COVID-19 pandemic, do you think the K-12 public schools in your area stayed closed to in-person instruction too long, not long enough, about the right amount of time, were never closed, or are you not sure? | Too long / Not long enough / About right / Never closed / Not sure |
| Q8 | Vaccine | Public health officials recently recommended an updated vaccine for COVID-19. Do you think you will probably get one, probably not get one, or have you already received one? | Probably get / Probably not / Already received |
| Q9 | Astrology belief | Do you believe in astrology, that is, the position of the stars and planets can affect people's lives? | Yes, believe in / No, don't believe |
| Q10 | Horoscope frequency | How often, if ever, do you consult astrology or a horoscope? | Daily / At least weekly / Once or twice a month / Once or twice a year / Never |
| Q11 | Police confidence | How much confidence, if any, do you have in police officers to act in the best interests of the public? | A great deal / A fair amount / Not too much / No confidence at all |
Note: Q4 was a form-split item (Pew randomly assigned half the sample to each form), so its source n is roughly 4,800 against ~9,500 on the others. The validation harness handles the source-n difference at the cell level via the coverage rule.
Three iterations, one interesting arc
This project required nearly $200 in API credits through Anthropic. Prior to committing the capital to this question, it was important to evaluate a few options and a production scaffolding layer that would improve my probability of success. Three iterations were evaluated during Stage A of the experiment.
Iteration 1 · Ask the LLM to pick one answer
The first paid canary (n=100) used the obvious approach: send an LLM the respondent's narrative, survey questions, and answer options. Ask it to pick one answer and explain. This is what most synthetic-respondent papers do.
It immediately reproduced the Bisbee failure pattern. Some examples:
- Question 4 (confidence in scientists): 84% of synthetic respondents picked “fair amount” vs Pew's 51%.
- Question 9 (belief in astrology): 99% picked “no” vs Pew's 73%.
Iteration 2 · Patch the prompt
The first instinct was to fix the prompt. The prompt adjustments were as follows:
- Addition of explicit anti-center language: "LLMs systematically over-pick the safe middle answer; you must not do this"
- Inclusion of structured trait blocks sent alongside the juror narrative, and
- Temporal alignment framing: "answer this question as the person would have on October 21-27, 2024"
Iteration 3 · Ask for probabilities, not a single answer
The third iteration changed the question. Instead of asking the LLM to pick a single answer from a list of options, I asked “rate how likely this person is to give each answer”, yielding a probability vector summing to 1. I employed a deterministic sampler (a fixed hash function) to pick the actual answer after the prompt completion step.
This decouples the LLM's job (estimate the distribution) from the answer-picking step (random draw from that distribution).
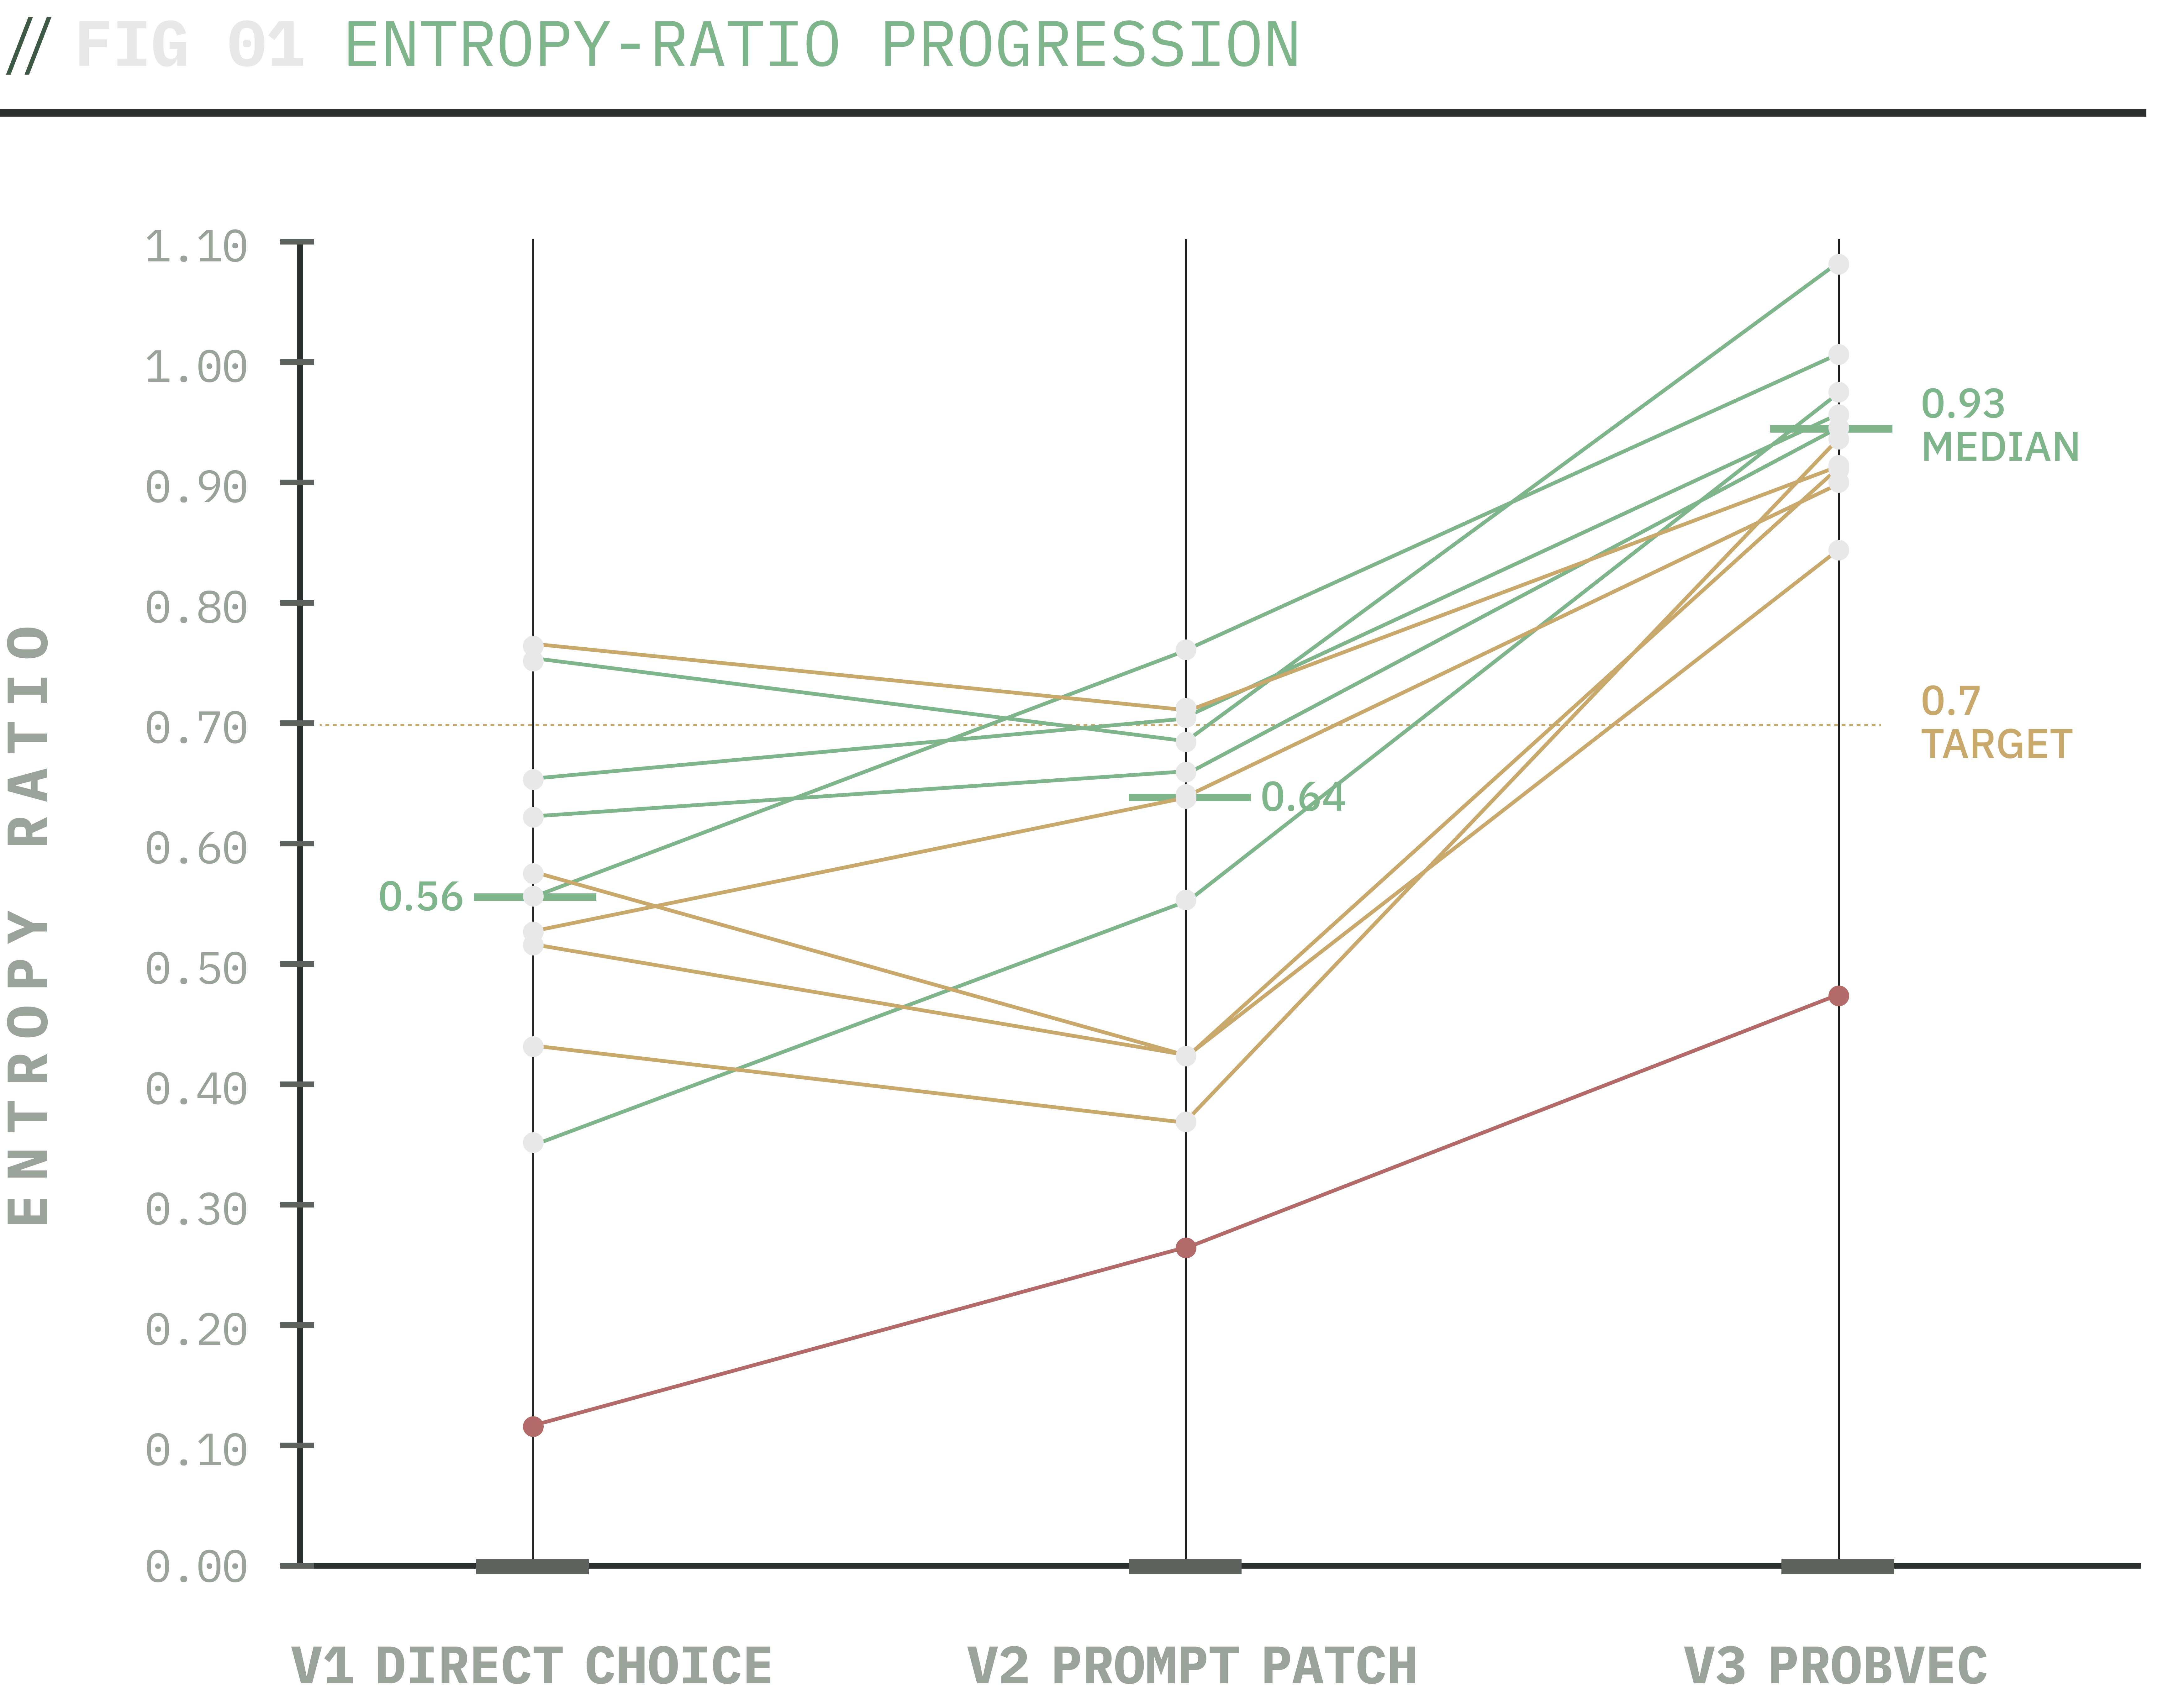
Slopegraph of per-question within-cell entropy ratios across the three polling iterations. The probability-vector protocol (V3) lifts every question's entropy ratio relative to V1; Q9 astrology is the residual outlier where the gap is structural rather than protocol-driven.
The entropy ratio jumped from 0.56 to 0.93 - close to perfect agreement with Pew's spread. Every single question improved.
After observing this result, I took more time reviewing the literature and found that this isn't a trick. Meister, Guestrin, and Hashimoto (2025) showed that LLMs describe probability distributions more accurately than they sample from them.
This is the application of their published finding. Asking the model to describe the answer distribution and then sampling externally outperforms asking it to commit to one answer. Direct-choice polling was indicting the architecture, but the architecture handled the variance fine; the polling format is the quality and rate-limiting factor.
The Pew Wave 158 result
Once comfortable with Stage A results, Stage B scripts were deployed and the process required ~18 hours. 1,000 synthetic respondents x 11 questions = 11,000 API requests against Pew W158's 9,593 real respondents. All 11,000 final responses landed. 410 transient API failures hit mid-run during a credit-exhaustion window; the failed-row repoll mechanism recovered every one of them.
Once enough demographic cells were measured to pass internally scripted validation requirements, we may evaluate the results.
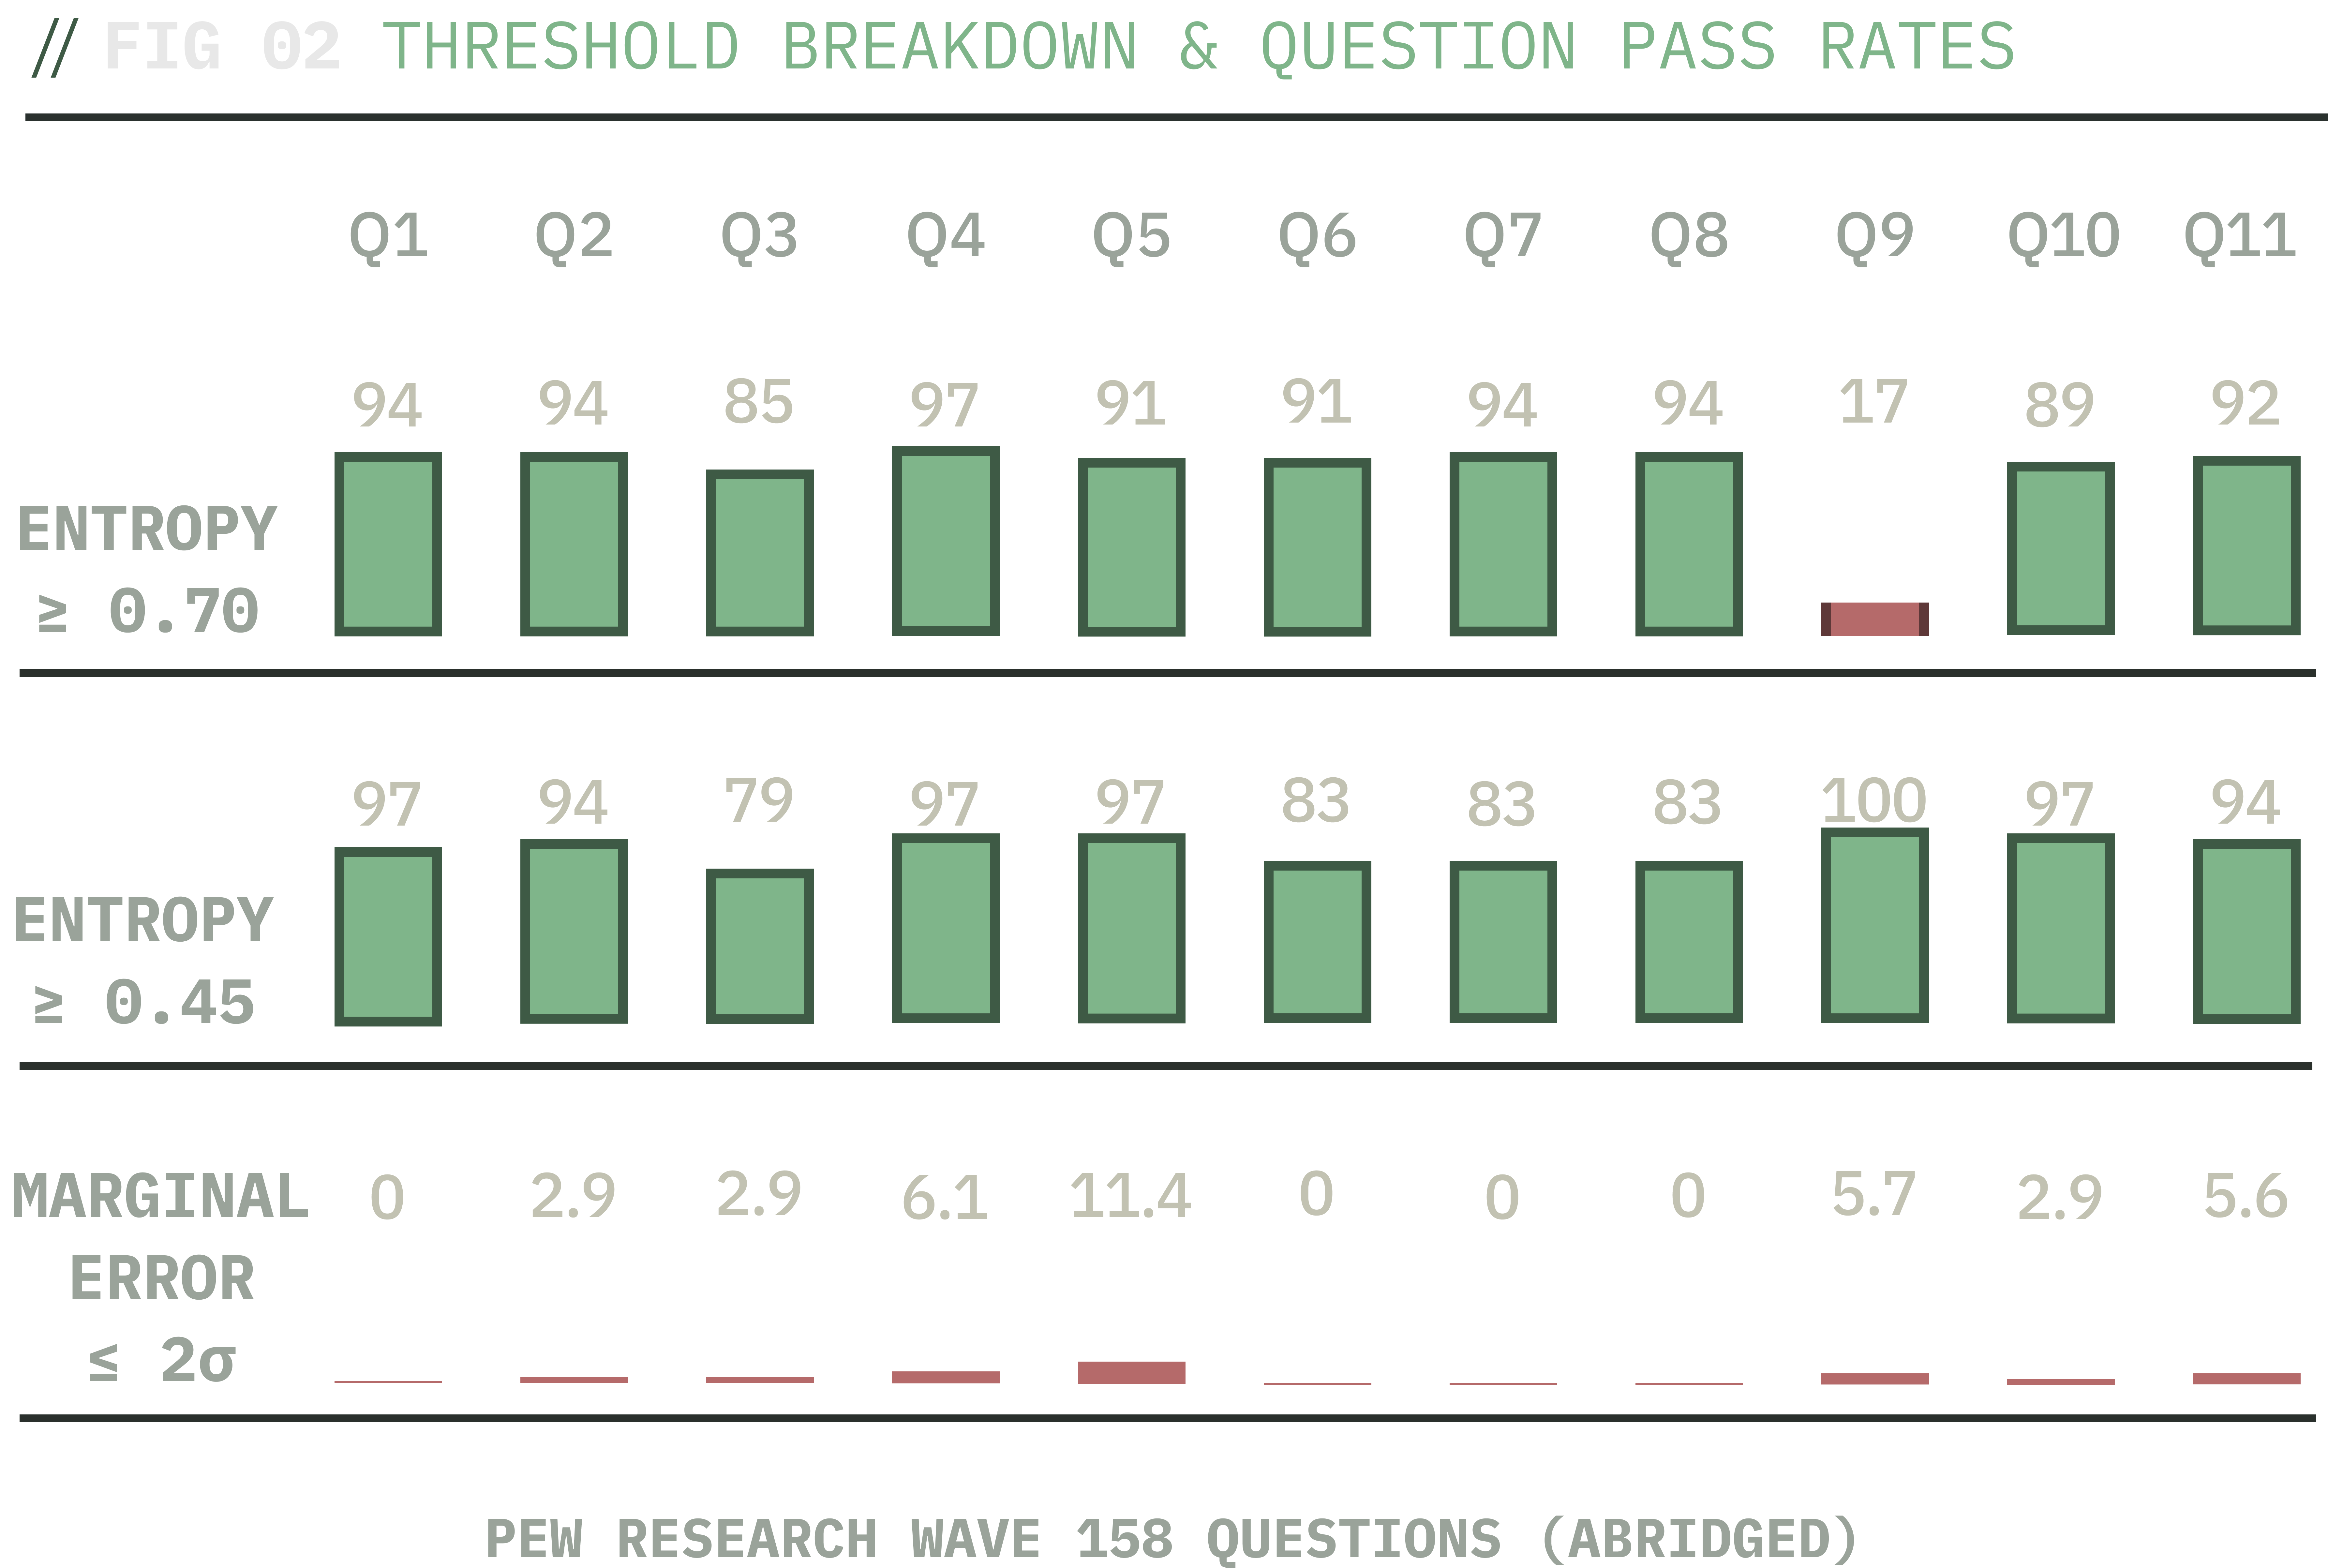
Stage B threshold breakdown. Two of three components clear cleanly on most questions; marginal-error sigma fails on every question and is the binding constraint on overall validation.
Three things to check per question, each measured per demographic cell:
Within-cell variance
Do synthetic respondents inside any given demographic vary as much as real Pew respondents do, or is everyone collapsed into a stereotype?
- Passes 85-97% of cells on 10 of 11 questions; Q9 (astrology) is the outlier at 17%. This is the Bisbee variance-collapse problem the construction techniques were built to defend against. Substantially mitigated with one noted exception.
Minority recovery
When Pew shows that 25% of a demographic group holds a position, does the synthetic panel attribute it to roughly 25% of that group, or erase the minority entirely?
- Passes 79-100% across all 11 questions. No broad cross-question minority-erasure pattern by this metric — Q9 astrology shows a different shape of minority gap (topline under-attribution) discussed below.
Marginal error
Does the synthetic panel's overall percentage on each answer option match Pew's within noisy fluctuation?
- This is the bottleneck. Every question fails it.
Shifts at the margins
The thresholds fail due to marginal error. The synthetic distributions have the right within-cell form but are systematically distorted at the top.
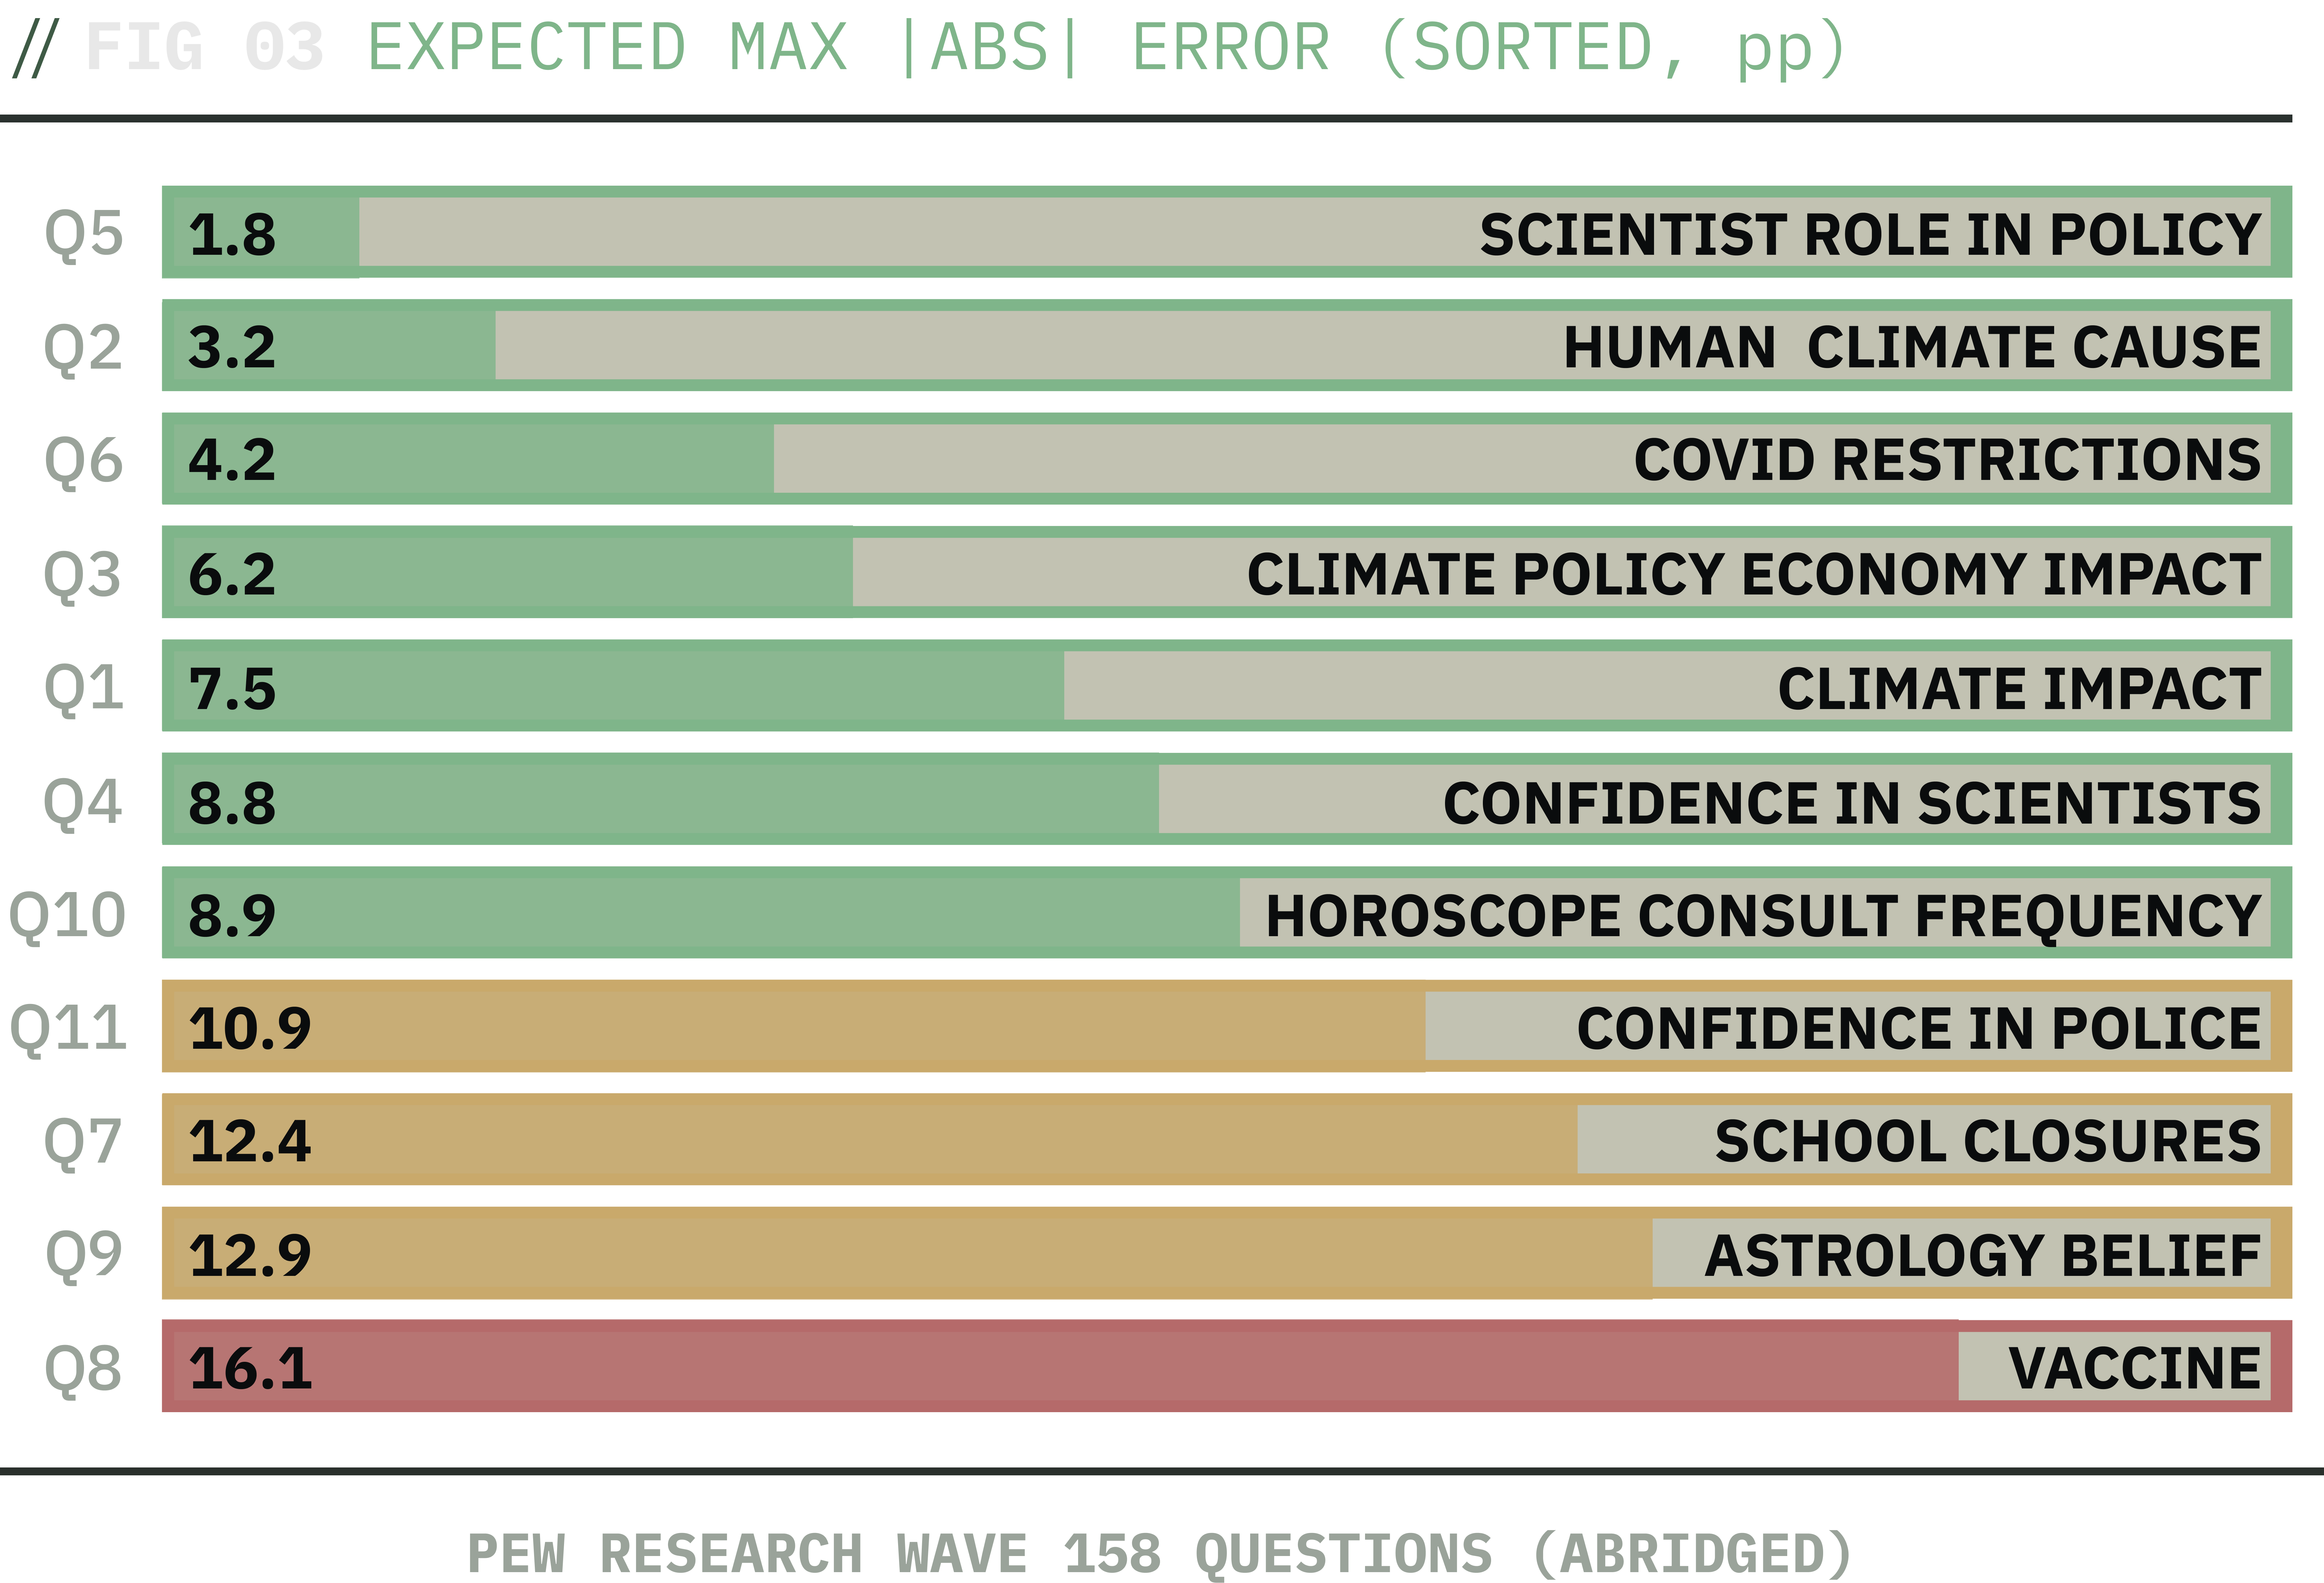
Per-question max-absolute expected-distribution error, sorted ascending and color-coded by severity. The hash sampler contributes ≤ 3.2pp on every question (≤ 1pp on Q9 / Q11; Q3 worst at 3.16pp), so the bias is in the LLM's per-juror probability vectors, not in the post-hoc sampling. Whatever is wrong is something the model emits.
Figure 03 above shows the maximum absolute expected error in the distribution per question, sorted ascending and color-coded by severity (green under 10pp, orange 10-15pp, red over 15pp). Seven of 11 questions land within 10pp on every option. Q5 matches Pew, though this turns out to be order-dependent, as the canary section below shows. Questions 8, 9, 7, and 11 drive a residual gap.
The hash sampler contributes ≤ 3.2pp on every question (≤ 1pp on Q9 / Q11; Q3 worst at 3.16pp), so the bias is suspected to lie in the LLM's per-juror probability vectors, not in the post-hoc sampling. Whatever is wrong is something the model emits. If you're evaluating this work, find within the supplemental information analyze_w158_marginal_shift.py and marginal_shift_analysis.json
Three failures survive
The four worst questions resolve into three distinct failure modes when you look at the per-option breakdown. They are not three different topics on which the same generalized failure is observed.
| Failure mode | Pattern & Example (worst-option delta vs Pew) | Likely cause | Recoverable? |
|---|---|---|---|
| Directional swap |
One answer loses mass, another gains; shifts between two poles; a third option remains calibrated. Q8(VAX): “Probably not” −16.1pp, “Already received” +15.6pp |
LLM-training on distributions where topline differs—recent engagement shifts prior responses. | No; persists across models and answer order. |
| Binary minority suppression |
Minority positions are under-attributed where they’re common, shrinking real subgroup variance. Q9(ASTRO): “Yes, believe in” −12.7pp overall (−17pp for Black respondents) |
Knowledge-to-simulation gap (Meister et al. 2025); model makes right gestures but misapplies probabilities. | Partly; best case only narrows gap. |
| Fragmentation |
Moderate response volume shifts to other answers. Q7 “About the right amount” −12.4pp; Q11 “A fair amount” −10.9pp |
Mainly a presentation artifact—answer order impacts LLM output for moderate categories. | Yes; within ~5pp after answer order reversal (both models). |
The rest of this section details each failure more verbosely.
Q8 vaccine · a clean directional swap
The response “Probably not get an updated vaccine” loses 16.1pp against Pew 60.1%. “Have already received an updated vaccine” gains 15.6pp against Pew 15.2%. “Probably get” lands within 0.5pp of Pew. The result swings from one end to the other. The largest synthetic-subgroup deviations from the Pew topline cluster in liberal and strong-left media cells: very_liberal synthetic jurors lose 41pp on “Probably not get” and gain 32pp on “Already received” relative to the Pew topline; strong_left media-diet jurors show a similar 38pp gap. (Pew W158 doesn't carry ideology or media-diet axes, so these are subgroup-vs-topline comparisons, not matched cell-level ones.) The LLM thinks engaged-liberal jurors have already received the updated booster at much higher rates than the October 2024 reality. This is consistent with what is likely true in the model's recent training data: the model has simply seen more liberal engagement in vaccine-uptake discourse than about the actual ~15% topline uptake at the Pew field date.
Q9 astrology · binary minority suppression
“Yes, believe in” loses 12.7pp against Pew 27.3%. This is the Bisbee 2024 pattern at eye-level: the panel under-attributes a real minority position to demographics where it is actually common. The structural Black-respondent gap is 17pp; Pew has 37.6% Yes among Black respondents, the panel emits 20.5% expected Yes on that cell.
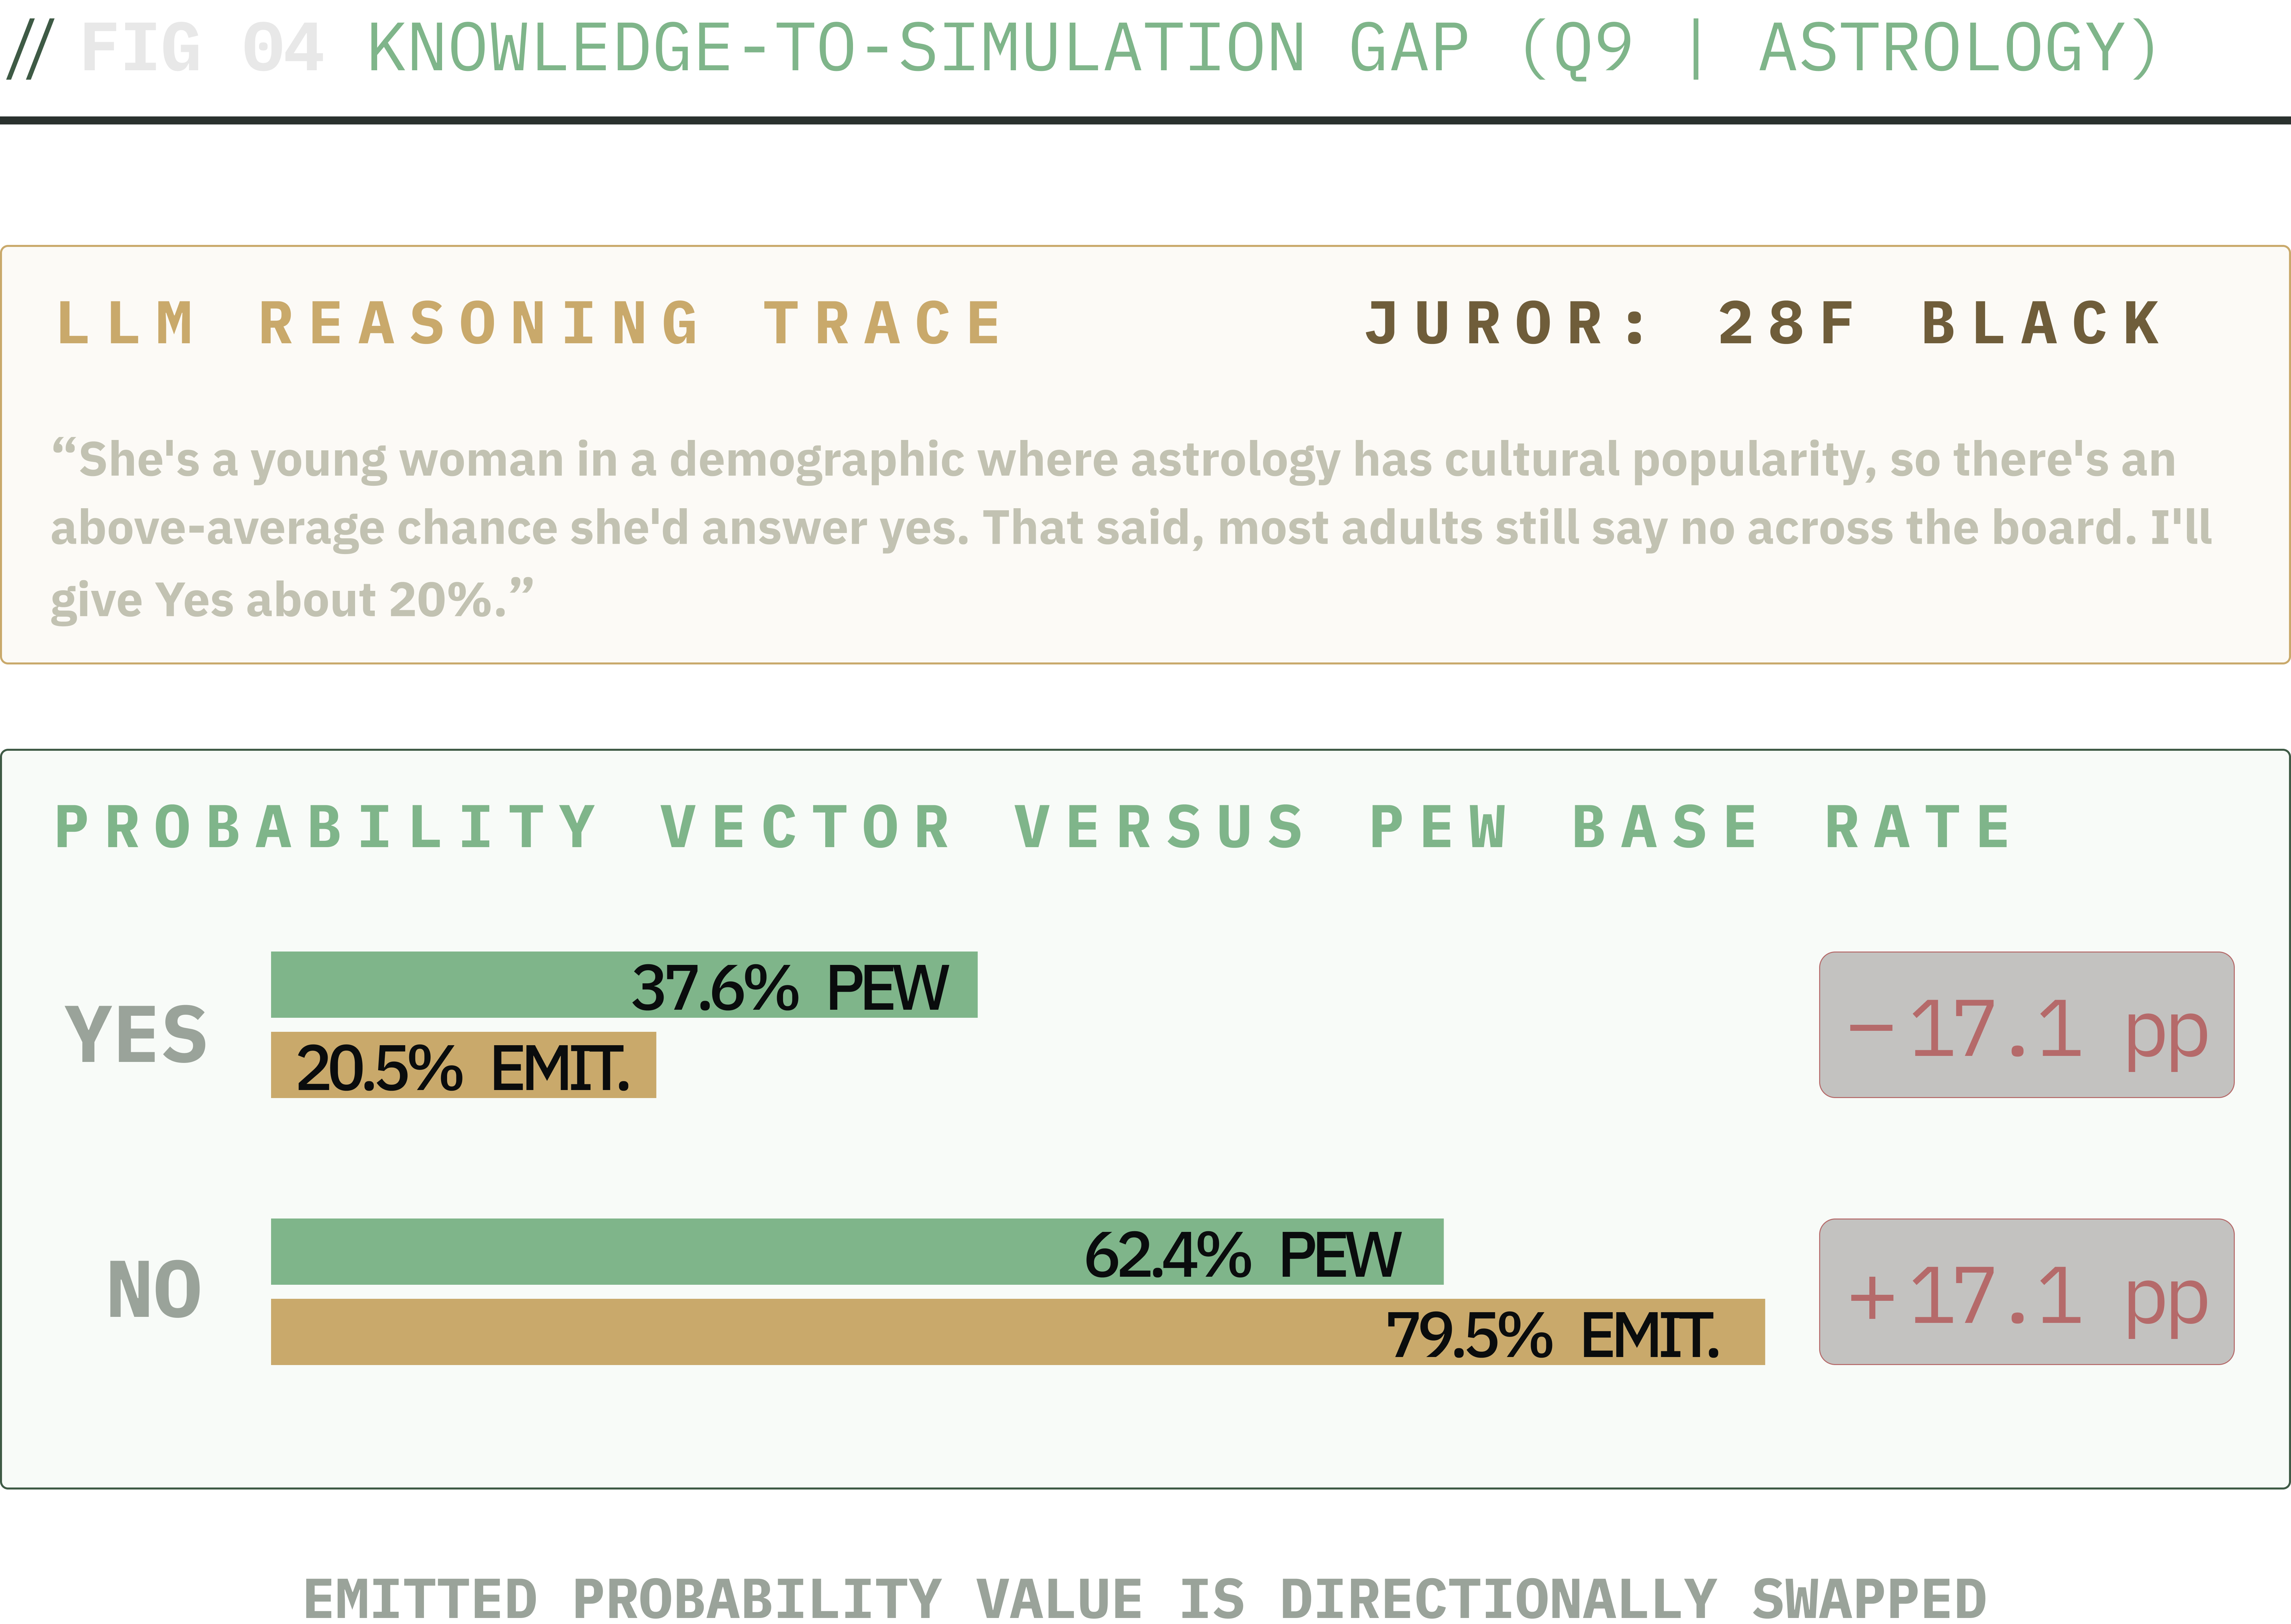
One juror's reasoning vs emitted probability vector on Q9. The model gestures at the right logic in writing, then emits a probability vector that does not apply it. The external sampler then draws from that vector deterministically; the issue appears to exist within the model.
The figure shows one juror from that cell. The reasoning excerpt acknowledges the demographic prior (“she's a young woman in a demographic where astrology has cultural popularity”) and then treats it as a small concession. The emitted probability vector assigns 20% to Yes. Across the cell, the panel does this consistently. The model will make gestures at the correct logic in writing, then emit a probability vector that does not apply it. This is the signature of the Meister, Guestrin, and Hashimoto (2025) distribution-expression finding (called the knowledge-to-simulation gap above; the term is this article's framing of the underlying phenomenon).
Q7 school closures · Q11 police · fragmentation
Both questions have a Pew moderate option (“about the right amount of time” on Q7; “a fair amount of confidence” on Q11). On Q7, “about right” loses 12.4pp; the share volume spreads to “too long” (+4.9), “not sure” (+4.7), and “never closed” (+3.0). On Q11, “fair amount” loses 10.9pp; mass spreads to all three other options. This third failure mode amounts to hedging on charged or sensitive topics with a moderate option.
Discriminating the causes: a 2x2 canary run
To diagnose what was driving the residual errors, I ran two targeted tests. If the failure is the LLM's internal “what does this demographic believe” prior, swapping models shouldn't help since the next model likely has a similar prior. If the failure is a presentation artifact (the model anchoring on whichever answer is listed first or last for example), reversing the option order should move it. So: same jurors, same questions, but permute the model (Sonnet 4.6 vs Opus 4.5) and the option order (Pew's original vs reversed). Four arms total, 200 jurors per arm, four questions (Q5, Q8, Q9, and Q11). Any movement across arms is attributable to model, order, or the interaction between them.
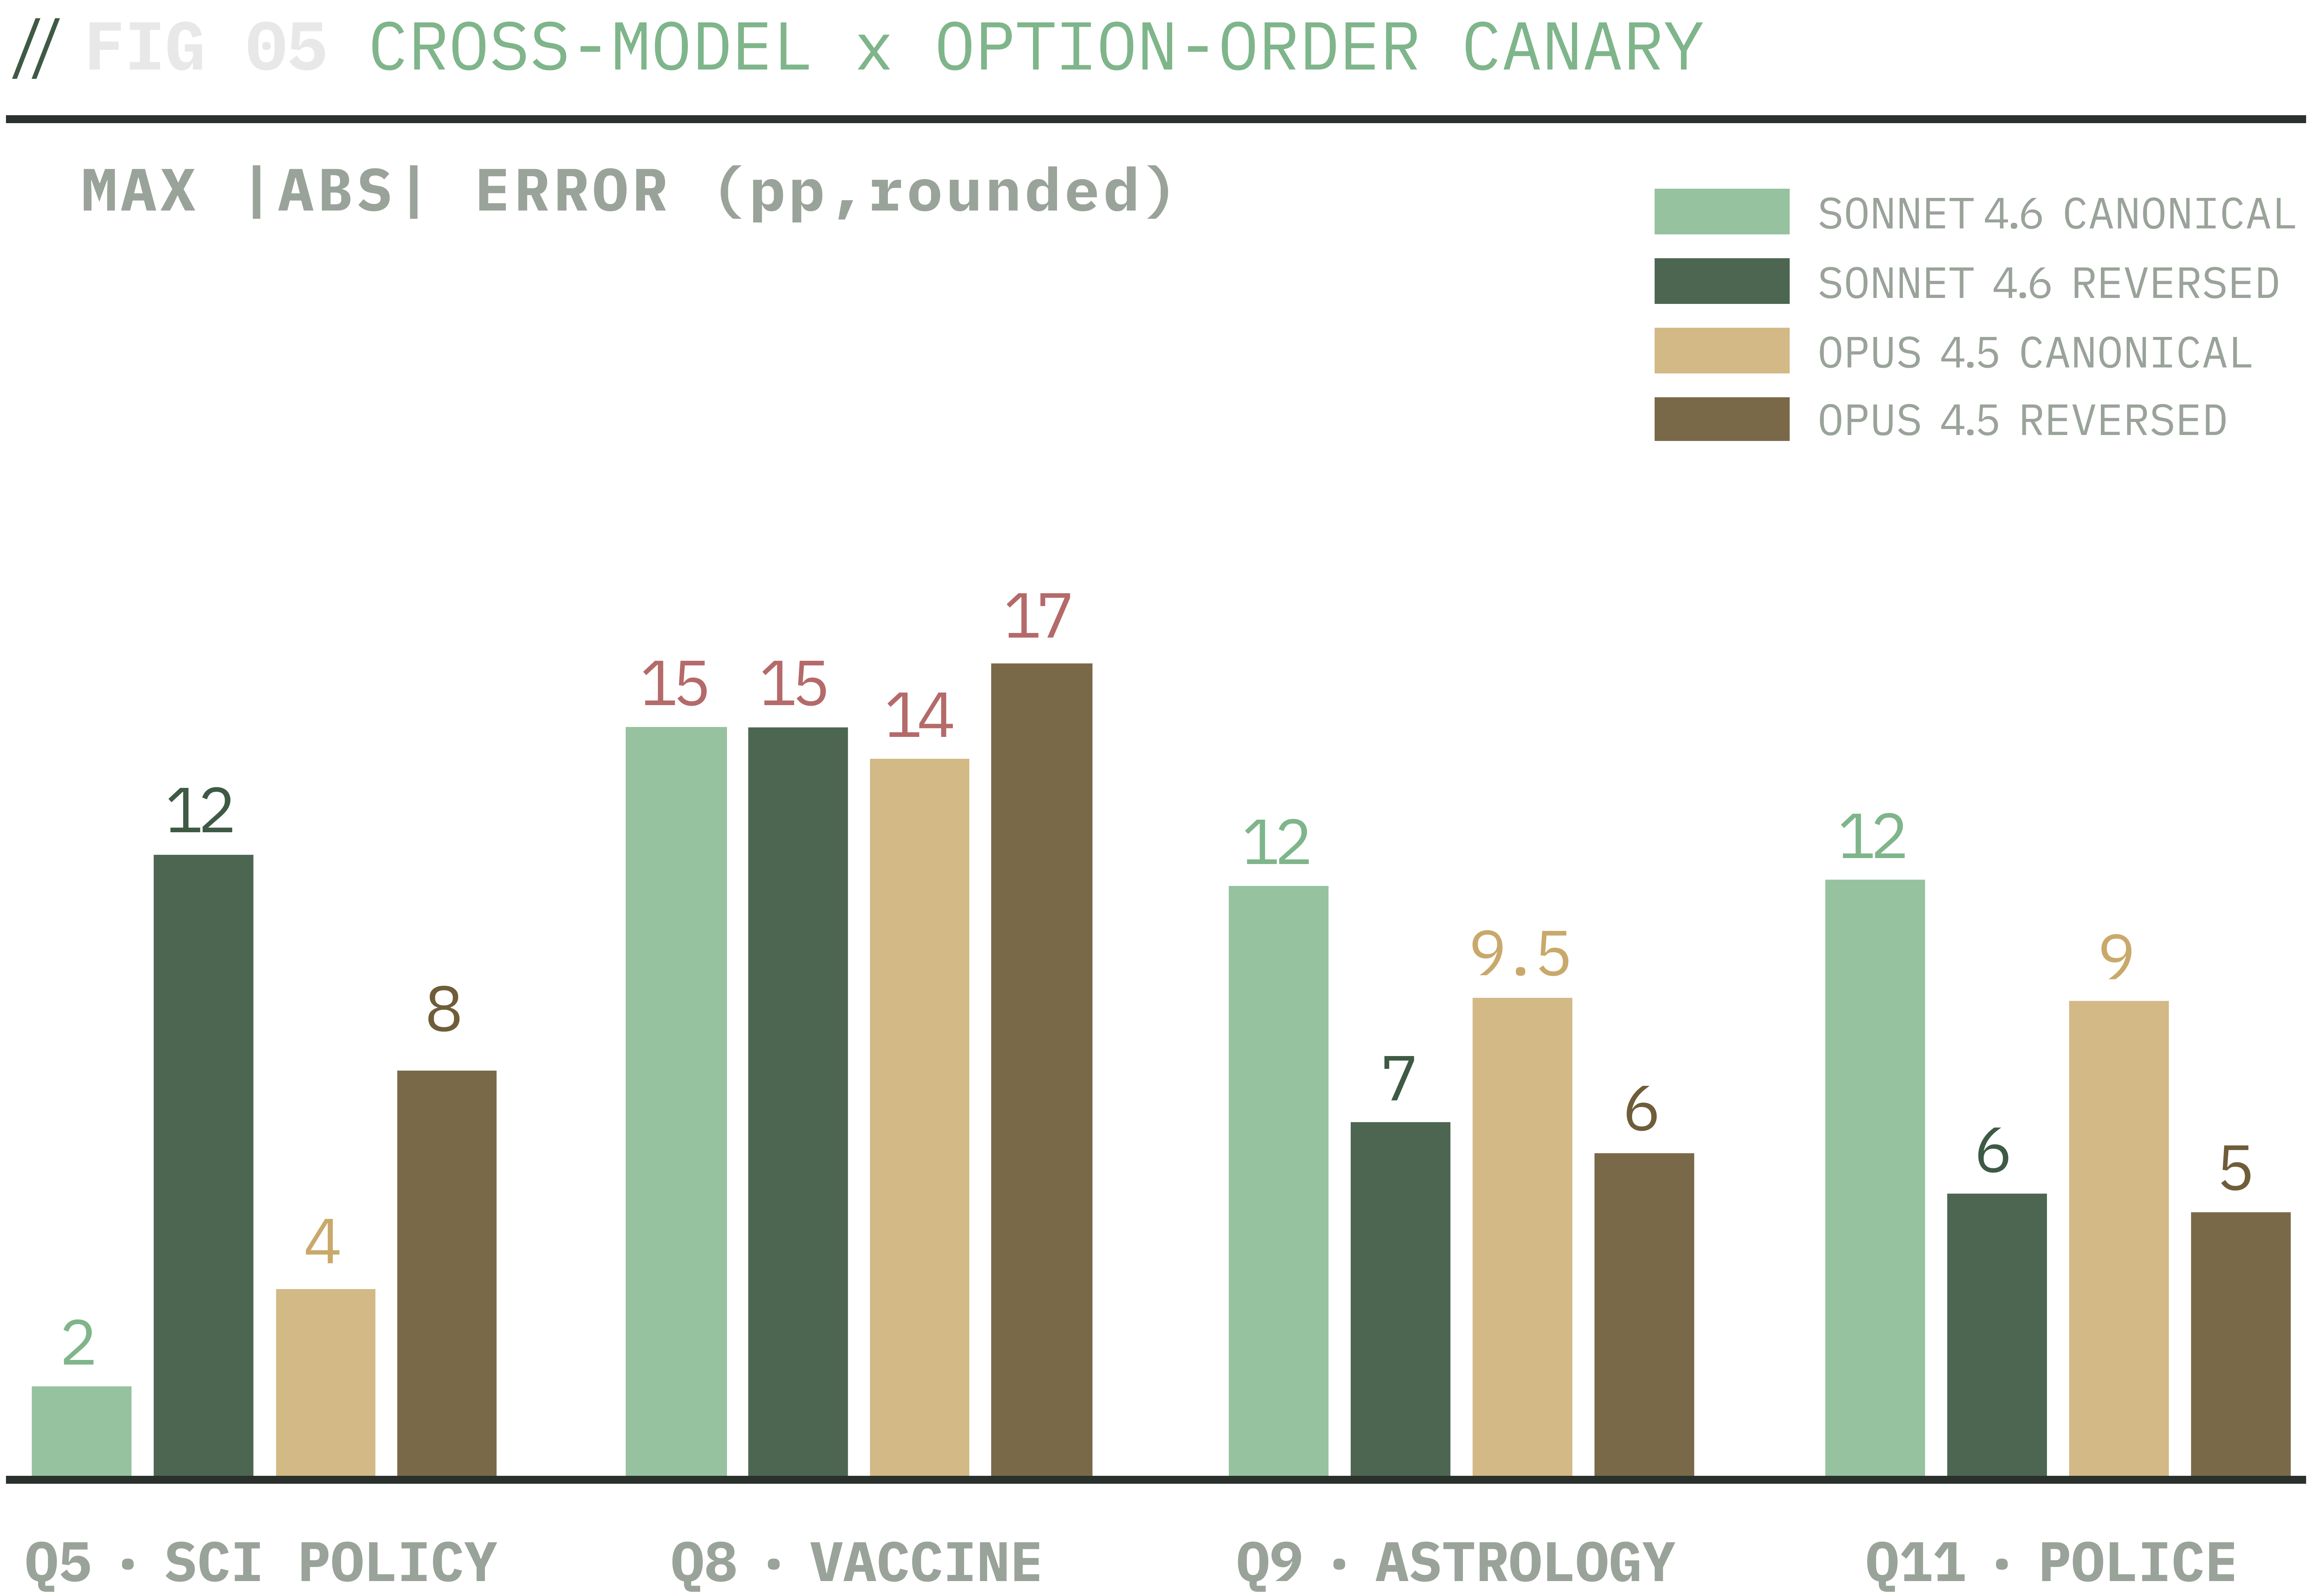
Cross-model x option-order canary. Model swap (Sonnet 4.6 vs Opus 4.5) leaves bias-direction options nearly identical at canonical order; option-order reversal moves Q9 and Q11 substantially closer to Pew while destroying Q5's near-perfect calibration.
Three findings from this test:
Finding 1 · Main errors remain despite swapping the model
When asking the Pew questions in the original order, Opus matches Sonnet within ~3pp on every question on the bias-direction options. The issue appears to be at the Claude-level. The same pattern appears on Opus 4.5. The “Probably not get an updated vaccine” rate on Q8 sits at 45-46% on Sonnet-forward and 46% on Opus-forward; Pew has 60%. Switching to Opus leaves the missing 15pp of vaccine refusal mass in place, and Opus costs 5 to 7 times more per call.
Finding 2 · Option presentation order is a large effect and direction-dependent
Reversing the options on Q5 destroys the near-perfect baseline calibration: max error jumps from 2.1pp (Sonnet-canonical) to 12.3pp (Sonnet-reversed) at the matched n=200 canary baseline; the Stage B n=1,000 baseline on Q5 was 1.8pp. The model boosts whichever option lands last in the presentation. On Q9 astrology and Q11 police, reversal materially improves the result from both models: Q9 from 11.7 to 7.0pp on Sonnet (9.5 to 6.4pp on Opus); Q11 from 11.8 to 5.6pp on Sonnet (9.4 to 5.2pp on Opus). On Q8, the bias direction is stable across orders, but response volume redistributes between the two non-modal options.
Finding 3 · A likely model-to-order interaction exists
A real model-to-order interaction exists. On Q5 reversed, Sonnet and Opus diverge by 14.1pp on the “Better” option; Sonnet shows a strong recency boost (43.8% canonical -> 53.8% reversed), while Opus stays near its canonical estimate (40.2% -> 39.7%). Across the four canary questions, Sonnet is consistently more order-sensitive than Opus. The earlier “cross-model effect is small” framing applies only at canonical order on the questions that matter for the bias story. The methodology lesson is that any cross-model comparison should be conditioned on option order.
Two diagnoses I retracted
The marginal-shift analysis I ran the morning before the canary said Q5 was the calibrated control and Q11 was exhibiting polarization from an LLM prior. Upon review, it was evident that the canary destroyed both.
Q5's apparent calibration (1.8pp at Stage B n=1,000; 2.1pp at the matched n=200 canary arm) was order-dependent. Reversing the options moved the error to 12.3pp on Sonnet at n=200. The LLM boosts whichever option comes last. Q5 is a poor control, and it would be easy to miss if not for testing answer order.
Q11's “fair amount” loss was mostly an option-order artifact. “Fair amount” recovers from 40-43% to 47% on both models under reversal (Pew 52.1%). The remaining ~5pp gap is plausibly residual error, but from my cursory look into survey-methodology, this magnitude for bias is typically averaged out thanks to proper option rotation in the first place.
Regression coefficient comparison
Direction agrees, magnitude does not
Bisbee 2024's strongest claim was that synthetic survey respondents get the demographic patterns wrong. That should not be confused with the surface numbers (does the model coarsely mirror real respondents). A panel might match the overall “27% of adults believe in astrology” but say women are 1.2x more likely than men when Pew shows women are actually 2x more likely. Direction agrees, magnitude doesn't. Coefficients in a regression diverge from coefficients in the same regression on real respondents.
This is the test the rest of the article doesn't run directly. So I ran it.
What I did
For each answer option for all 11 questions, I asked: given a respondent's age, race, education, party, gender, region, ideology, and religion (Pew's 4-way grouping), how much does each of those predict picking THIS answer?
I used the same regression specification on Pew respondents and on the synthetic respondents. The two sets of patterns are compared coefficient by coefficient. Primary analysis used the synthetic panel's probability vectors directly (the LLM's expressed probability that the juror would pick each option). Secondary analysis used the deterministic post-hoc sampled responses. 1,000-iterations on both. Thresholds for success / partial / failure were codified in the analysis scripting process before I ran a single regression, git is the audit.
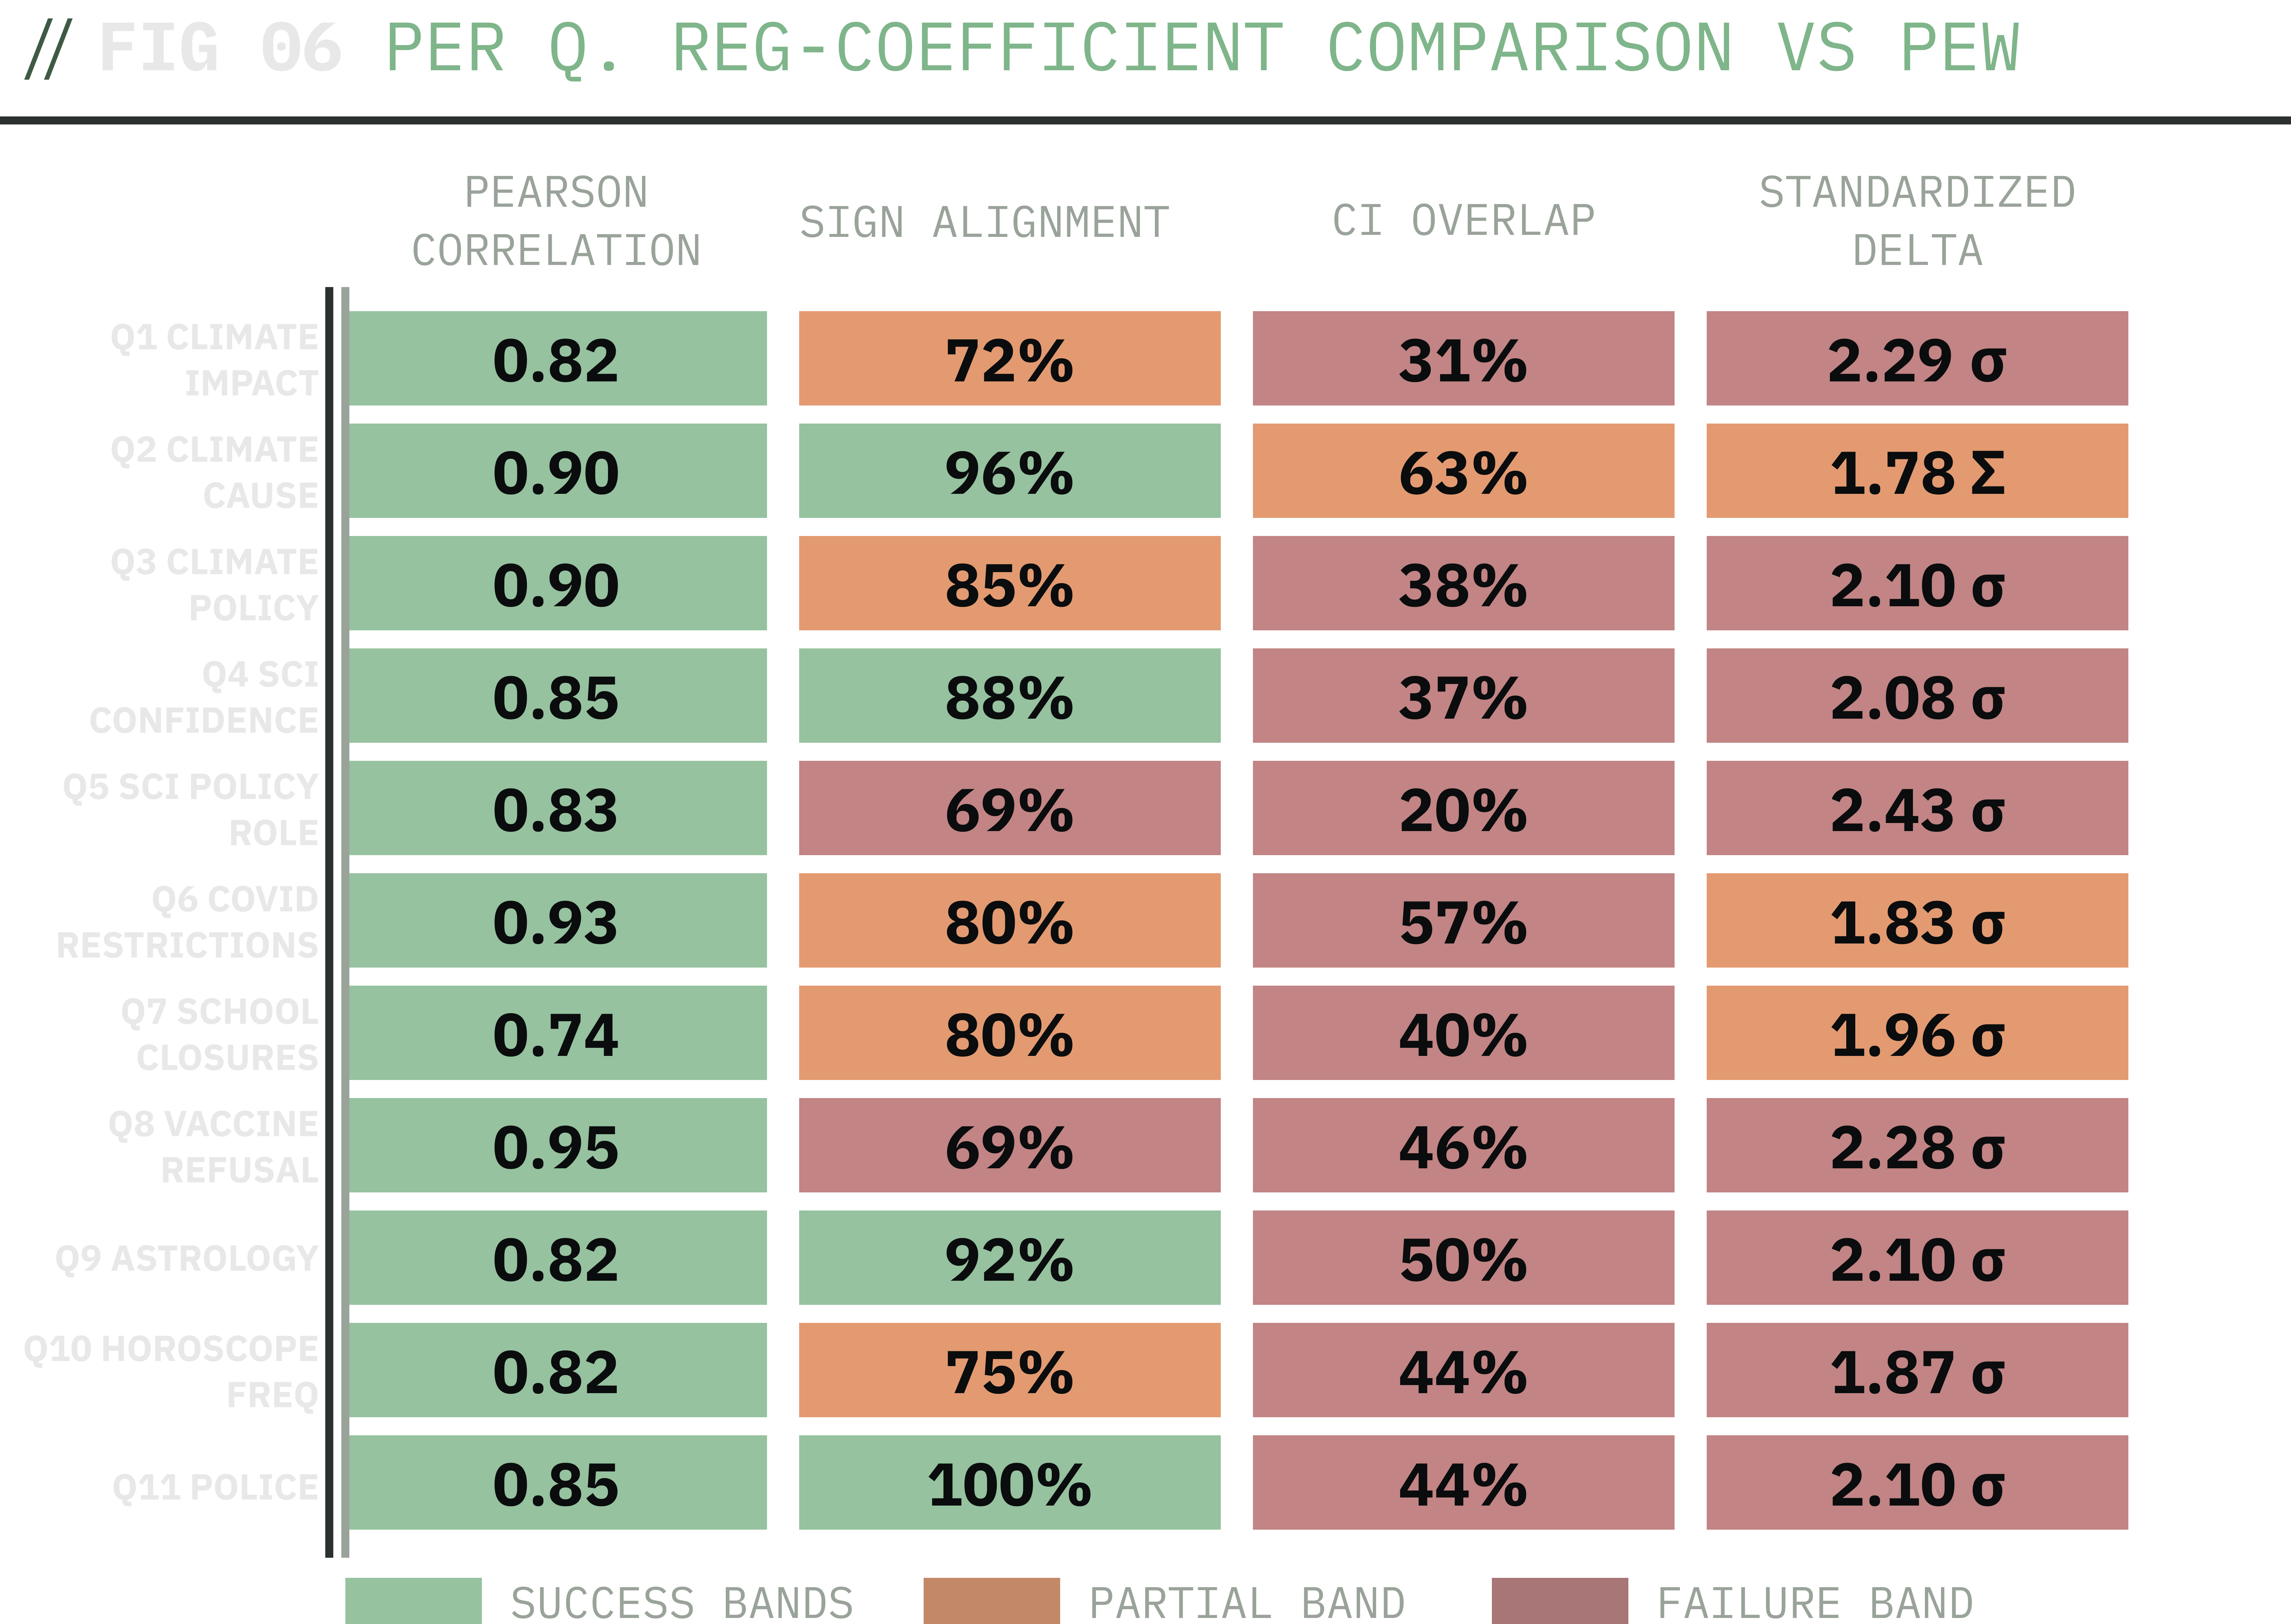
Per-question regression coefficient comparison: synthetic panel's probvecs vs Pew W158 respondents. Direction agrees (Pearson r > 0.70 on every question, median 0.85); magnitude diverges (44% CI overlap, median 2σ standardized gap).
To repeat myself..
The headline finding is that while the direction is right, the magnitude is wrong. Across all 11 questions, the synthetic panel's regression coefficients are highly correlated with Pew's (median per-question Pearson r = 0.85; every question lands in r > 0.70). On 80% of the coefficients that meaningfully differ from zero in Pew, synthetic agrees with Pew on the sign: same direction, same relative ordering of demographic groups.
But the magnitudes don't match. Only 44% of the synthetic panel's confidence intervals overlap Pew's. The median coefficient is roughly 2 standard errors away from Pew. In plain terms: on 80% of meaningful coefficients the panel recovers the direction of the demographic effect — which groups lean which way — but it does not get the size of those leans right. Under the scripted scoring rule (two of four metrics in the failure band), the primary analysis lands in the failure band.
The secondary analysis looks better..
When the comparison uses the panel's post-hoc sampled responses instead of the underlying probability vectors, the synthetic confidence intervals get wider. The sampling step adds noise that has to be propagated downstream. Wider intervals overlap Pew intervals more often (95% vs 44%) and the standardized magnitude gap shrinks (1.11 vs 2.10). So the underlying correlation has actually dropped (0.85 -> 0.74).
The point estimates don't get closer to Pew; the error bars just get bigger.
So the same gap is harder to detect statistically. Calling this “partial agreement” is honest but flattering.
The pattern is what the rest of the article would predict
Q6 COVID restrictions, the question that already had the cleanest calibration, has the tightest regression agreement (r = 0.93). Q5, the question that the 2x2 canary experiment established was order dependent, has the worst secondary correlation (0.37). Q9 astrology and Q8 vaccine both confirm the structural bias. There's high correlation, but standardized gaps of 2.10 and 2.28 show that the panel can't calibrate how strong each demographic effect should be. The 4-covariate sensitivity model (age, race, education, party only) lands in the same failure band, ruling out the worry that adding ideology and religion was masking the failure.
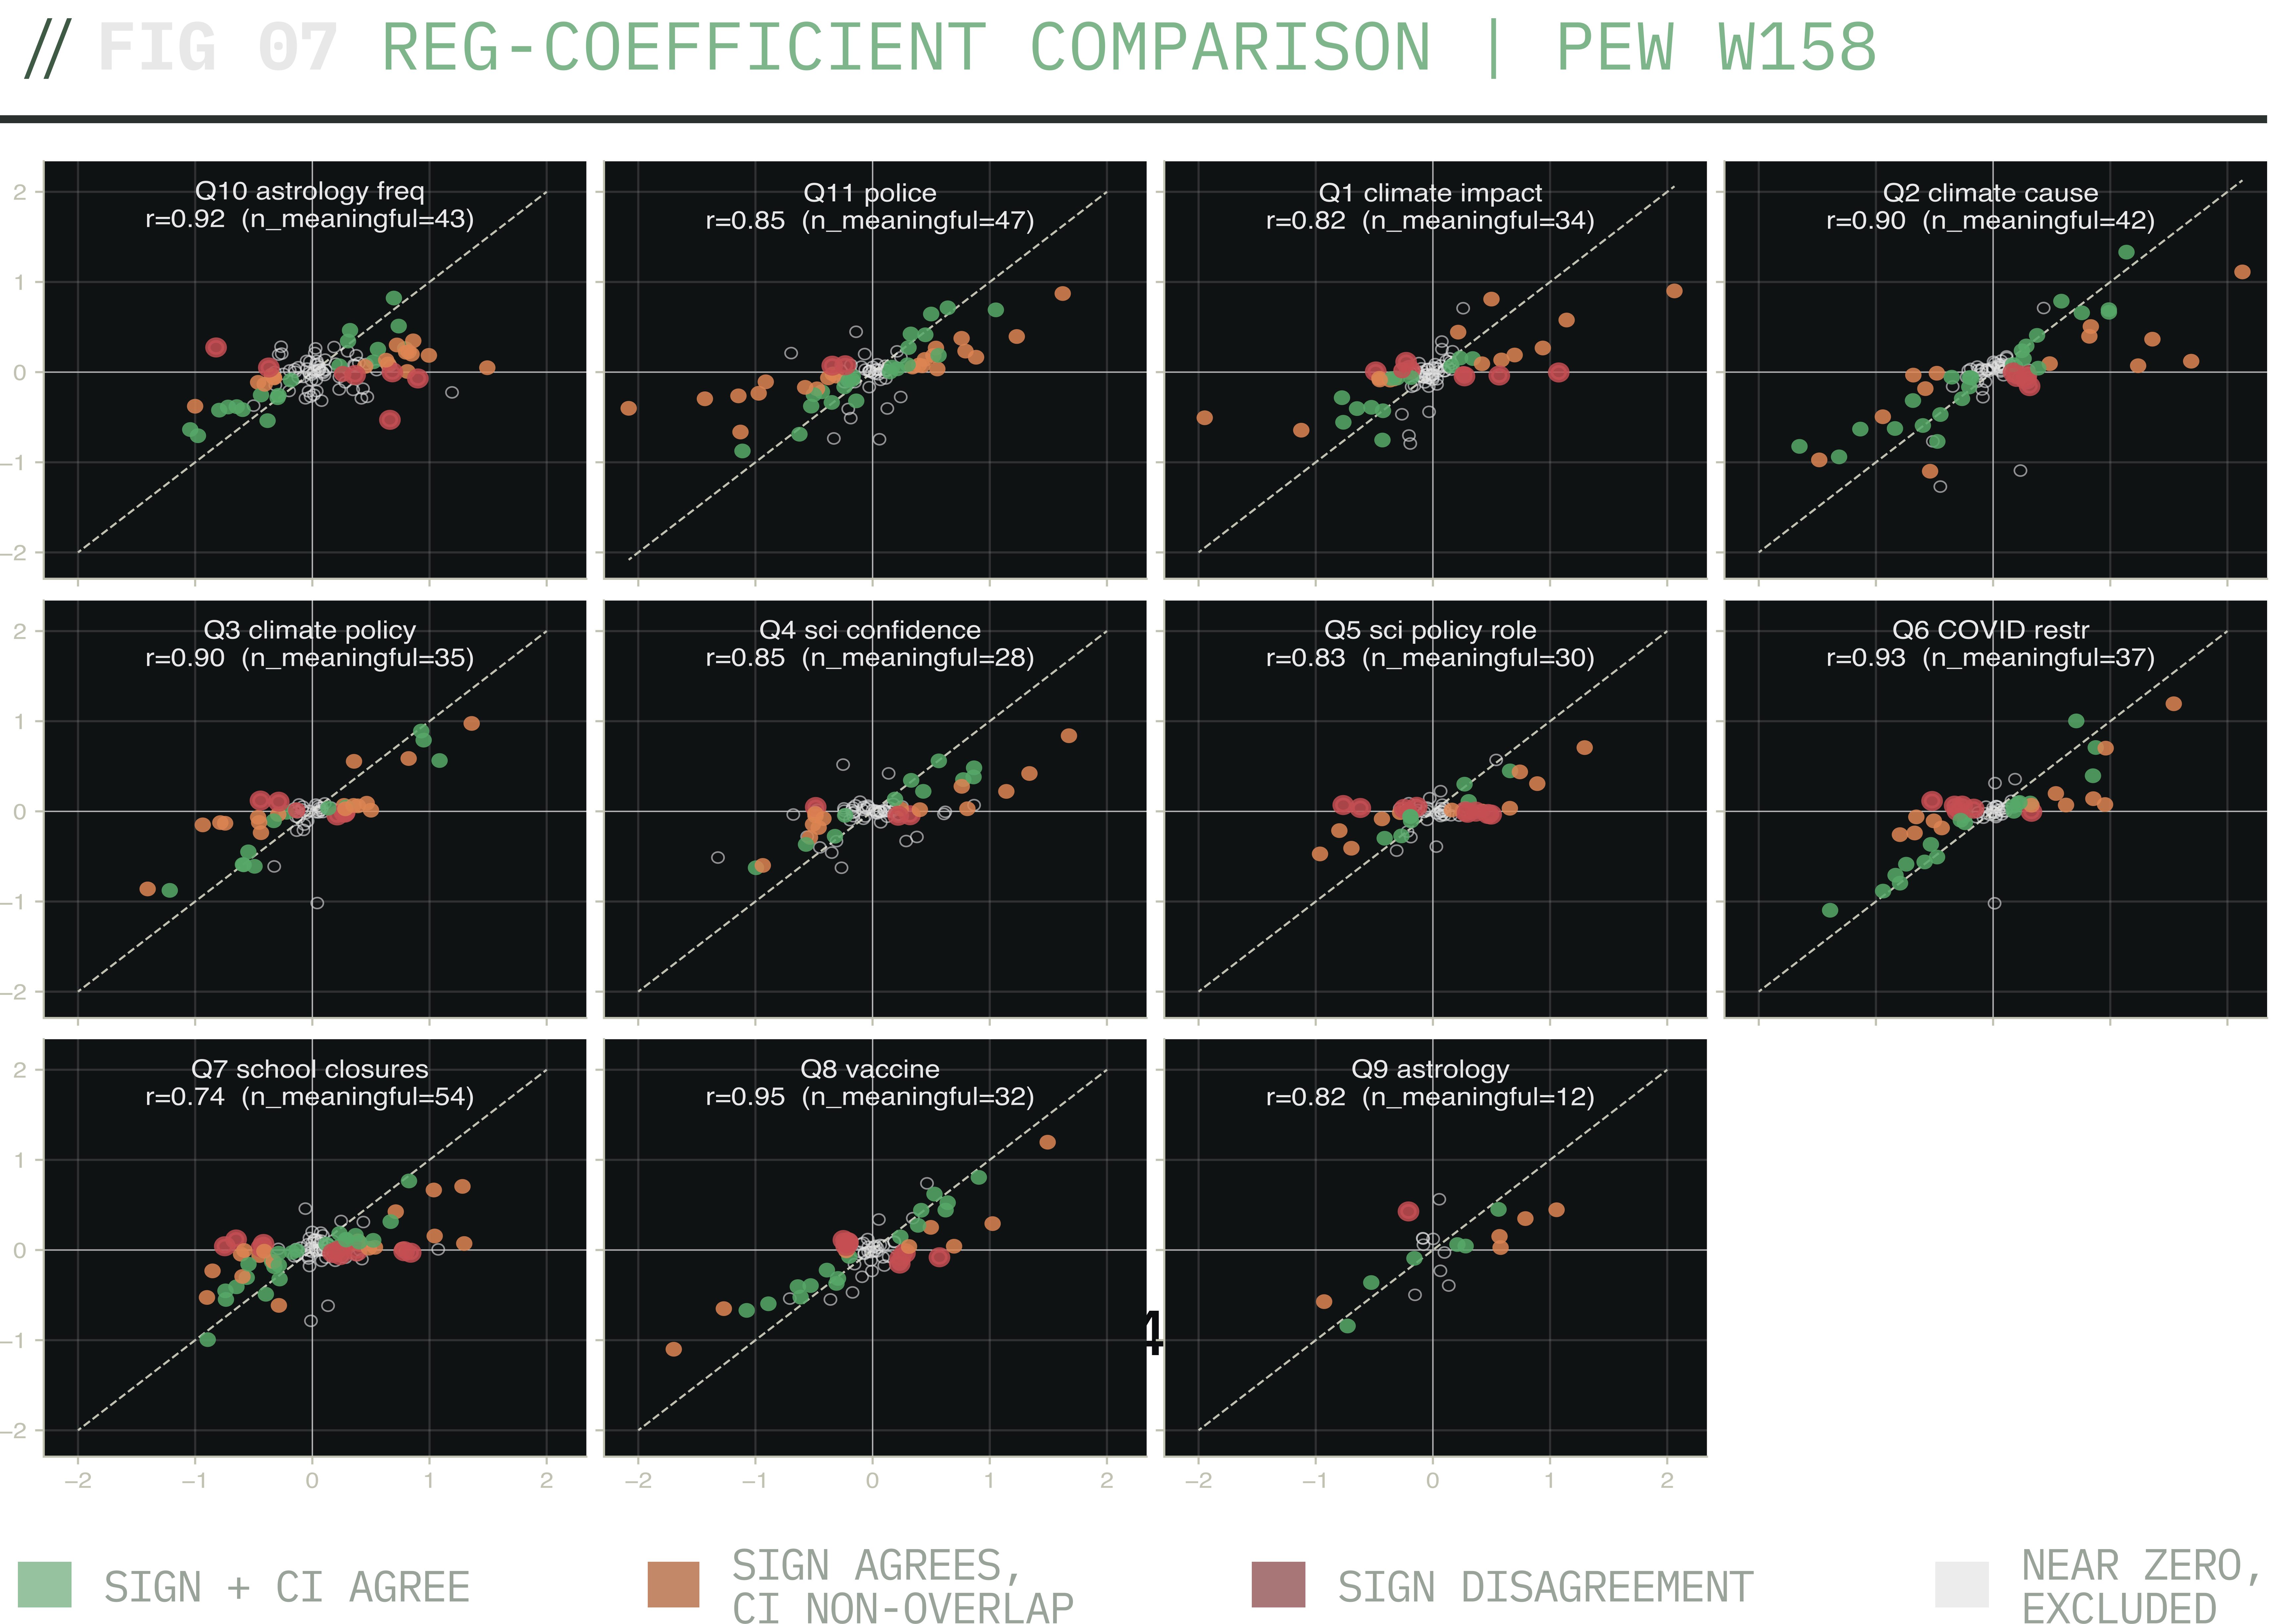
Per-question regression coefficient scatter. Each panel is one of the 11 Pew W158 questions; each point is a single demographic-covariate coefficient. Closer to the diagonal means synthetic and Pew agree on magnitude. The positive slopes show direction agreement; the spread off the diagonal shows the structural magnitude gap that lands the analysis in the failure band.
This confirms the article's main story. The marginal-shift analysis and cross-model canary both found the same thing: the LLM's probability vectors describe the right relationships and emit miscalibrated magnitudes anyway. The regression analysis concludes the same at the demographic level. The Bisbee critique on regression coefficients replicates in spirit. And it does so even when the metrics are split across analysis surfaces: the relationships agree (correlation 0.85) but the magnitudes diverge (44% CI overlap), and the only way to make the magnitudes “look like they agree” is to widen the error bars through a sampling step.
The synthetic panel mostly recovers Pew's direction of demographic effects (80% sign agreement on meaningful coefficients). It does not reproduce Pew's strength of demographic effects.
One caveat that bites Q9 specifically. Pew's 4-way religion grouping throws quite a significant number of religions into the “Other” category. These groups have different astrology beliefs. So the heterogeneity is lost at this aggregation level. While I assert the comparison to be valid, the religion coefficient on Q9 under-resolves the true between-group differences. A finer religion mapping could be done.
What this work shows
- One specific piece of the Bisbee (2024) critique, within-cell variance compression, is substantially mitigated on 10 of 11 Pew Wave 158 questions by swapping direct-choice polling for probability-vector polling. The synthetic panel's within-cell variance is as spread as Pew's on those questions. This is a narrow claim about variance compression specifically; the regression-coefficient component of the Bisbee critique was tested separately above and lands in the failure band for the probability vector primary (high Pearson r, low CI overlap and large standardized delta - right direction, wrong magnitude). Prompt and time sensitivity remain untested.
- The mitigation is explicable. It applies the Meister, Guestrin, and Hashimoto (2025) distribution-expression finding (the knowledge-to-simulation gap, in this article's terminology): LLMs describe distributions better than they sample from them.
- The remaining problem is qualitatively different from Bisbee-style centering-collapse. It is topic-specific marginal bias, separable by per-cell expected versus Pew diagnostics into protocol artifacts (Q11 fragmentation, recoverable by option-order randomization) and structural priors (Q8 vaccine surviving every perturbation tested).
Boundaries
- Replacement remains unproven. The artifact fails overall validation on every question via the marginal-error component.
- General validity remains unproven. This is one Pew wave, one model family, and one polling-primitive iteration arc. It should not be used to make investment, product, or other decisions without accounting for the boundary conditions or validating their expansion.
- Marginal bias remains unsolved. The Q8 “probably not get an updated vaccine” rate stays at 43-46% on every arm against Pew's 60%. Option-order randomization and cross-model swap both leave it in place.
- The Bisbee (2024) critique still stands as a broader warning. This work identifies one failure mode that probability-vector polling addresses, while exposing others that remain.
- Real production use for political polling, surveys, or large ad campaigns should remain out of scope in 2026. “The panel within-cell entropy matches Pew” is a necessary criterion; it is not a sufficiency criterion.
What this implies for product positioning
The augmentation, pretesting, and prioritization frame is what this kind of panel supports. Synthetic respondents can help decide where to spend the limited human survey budget; Ye and Yoganarasimhan (2026) formalize this in a recent preprint on LLM-augmented surveys. Such LLM-respondents may be used to pretest messaging comprehension before running a real survey, or to sweep a large hypothesis space for cheap directional analysis or identification tasks. Replacement is a different bar, and the W158 vaccine result argues against it on charged topics specifically. The narrower claim, “this surfaces plausible reads on un-charged questions and tells you where your real-survey budget is best spent on the charged ones”, is what the empirical data supports.
Limitations and reproducibility
There are five primary limitations to this study:
- Only one Pew wave was used (W158). No time-reproducibility rerun. Bisbee (2024) found that synthetic distributions shifted on month-scale reruns with the same prompts.
- The regression coefficient comparison ran on the 8-covariate intersection (age, race, education, party, gender, region, ideology, religion as Pew's 4-way condensed). Income (
F_INC_TIER2) and finer religion (F_RELIG11-way) are out of scope for this pass; the 4-way religion mapping under-resolves Q9 astrology heterogeneity across LDS/Orthodox/Jewish/Muslim/Buddhist/Hindu. - Only one model family was employed. The cross-model canary covers Sonnet 4.6 vs Opus 4.5; it does not cover non-Claude models.
- No nonsense or placebo question class. Bisbee suggests defining nonsensical tests when ground truth is unavailable.
- The panel construction depends on PUMS, Pew, GSS, and Census source priors plus a 17-runtime-guard validation harness, all of which are choices that an adversarial reader or methodologist could dispute.
The polling protocol was updated after the canary to randomize option order per respondent (deterministic shuffle keyed on sha256(juror_id|question_id|run_seed)). The W158 results above predate that change. The canary established the change as necessary. Any subsequent run uses the updated protocol.
The polling layer used Anthropic's Claude Sonnet 4.6 (default) and Claude Opus 4.5 (outlier persona expansion and the cross-model canary). Probability-vector polling output was validated for exact option set equality, non-negative values, and sum within [0.95, 1.05]; vectors outside tolerance were not retried (LLM output problems, not transient), while API errors were retried once after a 15-second cooldown.
The supplementary information and methods package — selected aggregate artifacts, methodology documents, and figures — is published at github.com/zzirblake/the-jury-public. Raw IPUMS/Pew source data, real-sourced prior files, generated row-level synthetic juror outputs, API logs, and private working notes are not redistributed.
The V1 and V2 per-question entropy values in Figure 1 are sourced from contemporaneous raw tool output preserved in the methods package at results/v1_v2_canary_raw_output_2026-05-16.txt and the lab-notebook transcription at docs/v1-v2-canary-provenance.md. The on-disk V1 directory was overwritten with V2-era data before the project went under git tracking; the overwrite is documented in the provenance file with a sha256 identity check and a mechanistic argument. The V3 figures and all Stage B n=1,000 results are independently recomputable from the on-disk artifacts and are unaffected.
References
Bisbee, J., Clinton, J., Dorff, C., Kenkel, B., & Larson, J. (2024). Synthetic replacements for human survey data? The perils of large language models. Political Analysis.
Meister, N., Guestrin, C., & Hashimoto, T. (2025). Benchmarking distributional alignment of large language models. NAACL.
Argyle, L. P. et al. (2023). Out of one, many: Using language models to simulate human samples. Political Analysis.
Santurkar, S. et al. (2023). Whose opinions do language models reflect? ICML.
Hwang, E. J., Majumder, B. P., & Tandon, N. (2023). Aligning language models to user opinions. EMNLP Findings.
Park, J. S. et al. (2024). LLM Agents Grounded in Self-Reports Enable General-Purpose Simulation of Individuals. arXiv:2411.10109.
Li, X., Li, K., & Qiu, X. (2025). ChatGPT is not a man but Das Man. arXiv:2507.02919.
Ye, X., & Yoganarasimhan, H. (2026). Rectification difficulty and optimal sample allocation in LLM-augmented surveys. arXiv:2604.17267.
Source data: IPUMS USA ACS 2024 1-year PUMS extract (Ruggles et al.); Pew Research Center American Trends Panel Wave 158 microdata; conditional prior crosstabs from Pew NPORS 2025, Pew ATP W133, Pew Religious Landscape Study 2023-24, Pew News Platform and Social Media Fact Sheets, Pew “Political Gap in News Sources” with AllSides Media Bias Chart v11, US Census Current Population Survey ASEC 2023, and General Social Survey multi-issue batteries 2018-2022. None of the source data is redistributed.